Free Access
Fig. 13
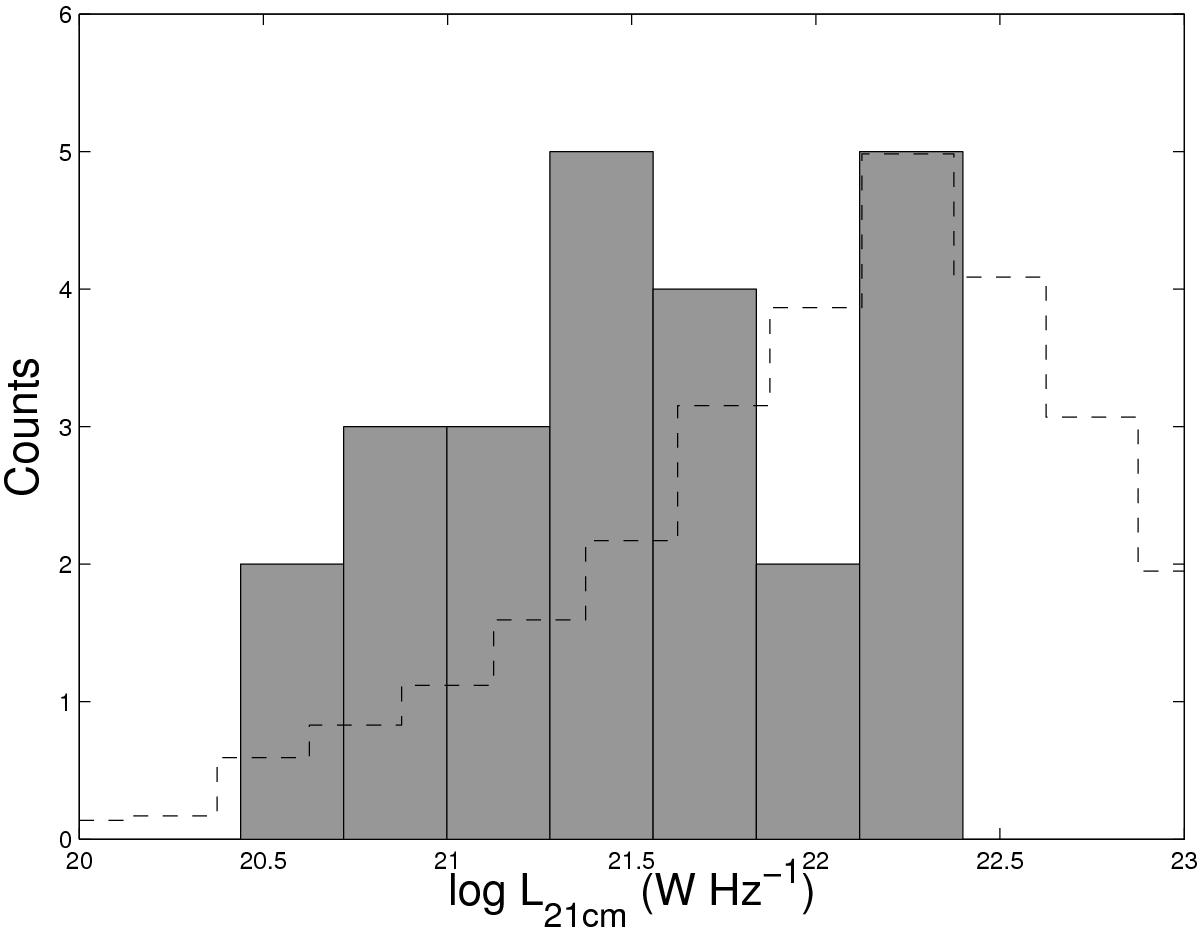
Distribution of 21 cm radio continuum luminosities. The solid histogram displays the distribution of 21 cm radio continuum luminosities of the galaxies in the reduced Hi sample. The dashed histogram shows the distribution for the IRAS galaxies as derived by Yun et al. (2001).
Current usage metrics show cumulative count of Article Views (full-text article views including HTML views, PDF and ePub downloads, according to the available data) and Abstracts Views on Vision4Press platform.
Data correspond to usage on the plateform after 2015. The current usage metrics is available 48-96 hours after online publication and is updated daily on week days.
Initial download of the metrics may take a while.