Fig. 10
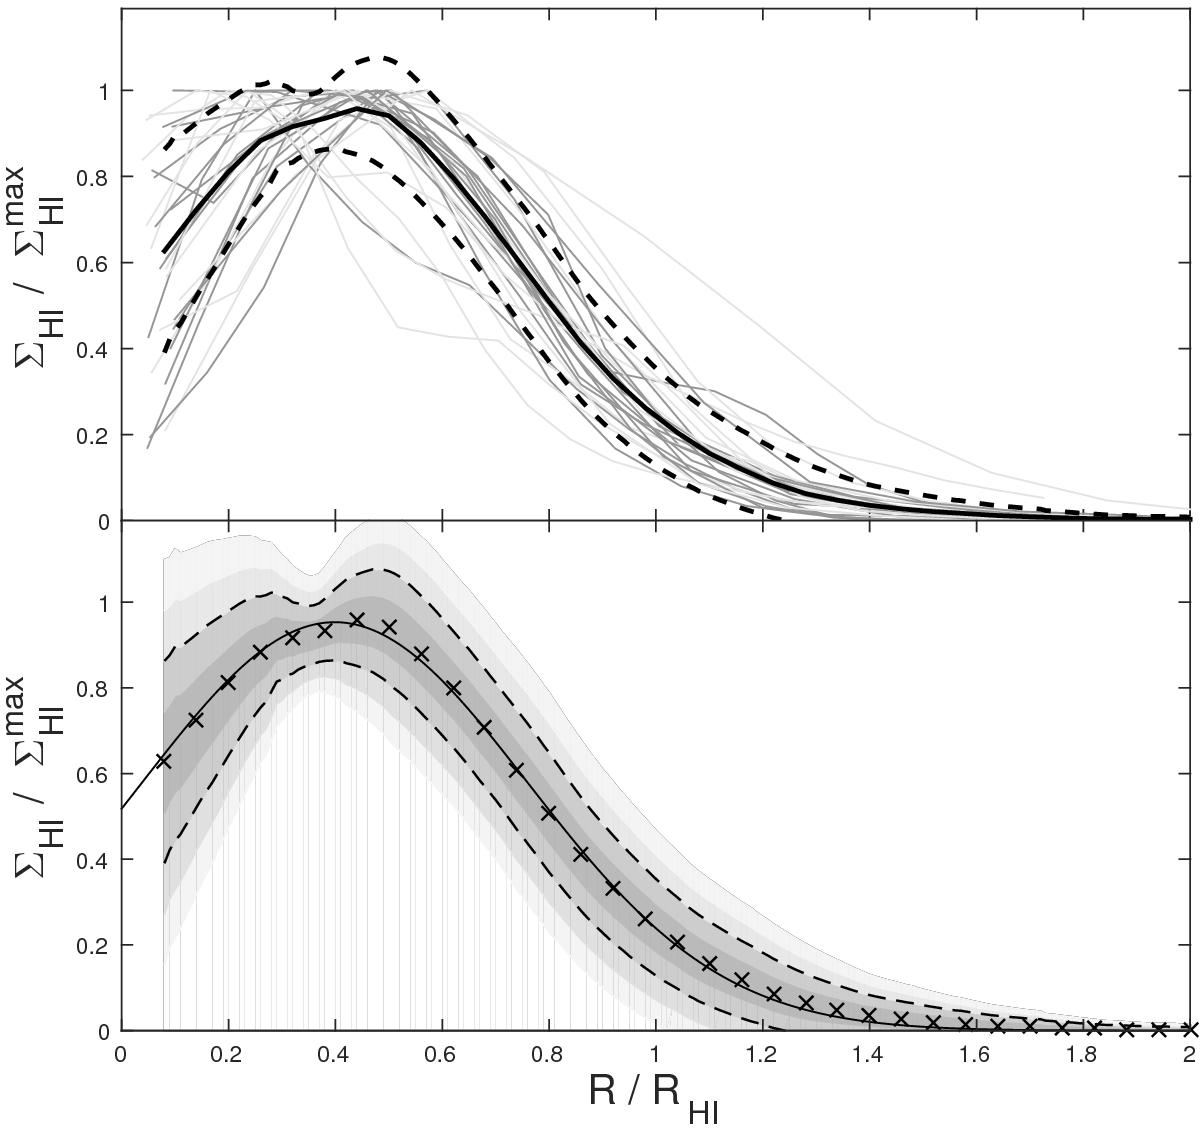
Self-similarity of the Hi column density profiles. Upper panel: all 28 ΣHI profiles scaled in radius and normalized in amplitude. The thinnest lines correspond to the early-type spirals in our sample. The thick black line shows the clipped average profile and the dashed lines indicate the rms scatter at each radius. Lower panel: the crosses follow the thick black line in the upper panel and the dashed lines are identical to the dashed lines in the upper panel. Gray scales indicate steps of 0.5 times the rms scatter. The solid black line is the best-fit Gaussian function following the crosses above (ΣHI/![]() .
.
Current usage metrics show cumulative count of Article Views (full-text article views including HTML views, PDF and ePub downloads, according to the available data) and Abstracts Views on Vision4Press platform.
Data correspond to usage on the plateform after 2015. The current usage metrics is available 48-96 hours after online publication and is updated daily on week days.
Initial download of the metrics may take a while.