Fig. 2
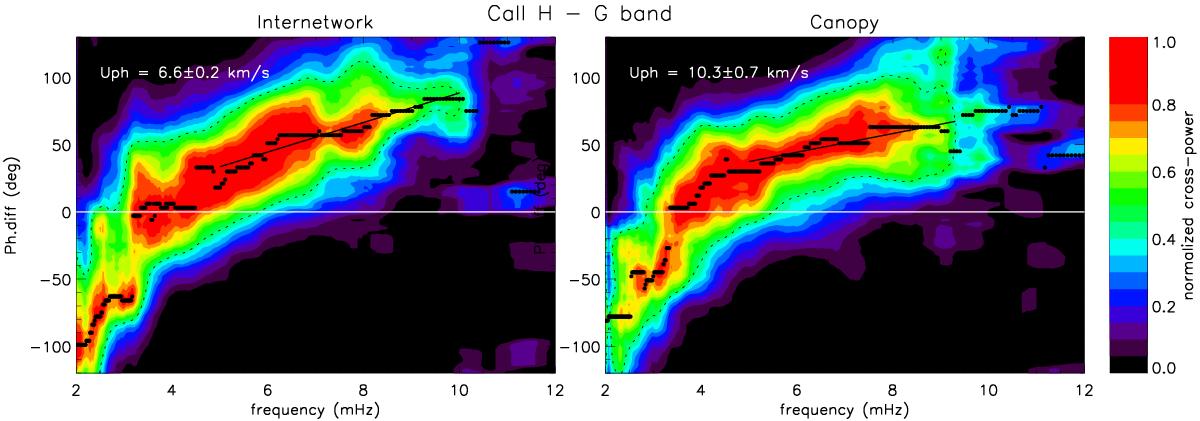
Phase differences between Ca ii h-G-band at the IN (left) and the magnetic canopy (right). Filled contours represent the crosspower distribution, black points denote the positions of maximum crosspower, normalized to unity for each frequency element, and the dashed contour indicates the 50% level from maximum crosspower (as an indicator of FWHM). Crosspower below 10% has been disregarded. Also, overplotted are regression lines calculated above 5.2 mHz up to the part of the distribution enclosed by the 0.5 contour. From their gradient, the corresponding phase velocities are calculated, assuming that the height separation between Ca ii h and G-band is 200 km (see text).
Current usage metrics show cumulative count of Article Views (full-text article views including HTML views, PDF and ePub downloads, according to the available data) and Abstracts Views on Vision4Press platform.
Data correspond to usage on the plateform after 2015. The current usage metrics is available 48-96 hours after online publication and is updated daily on week days.
Initial download of the metrics may take a while.