Fig. 1
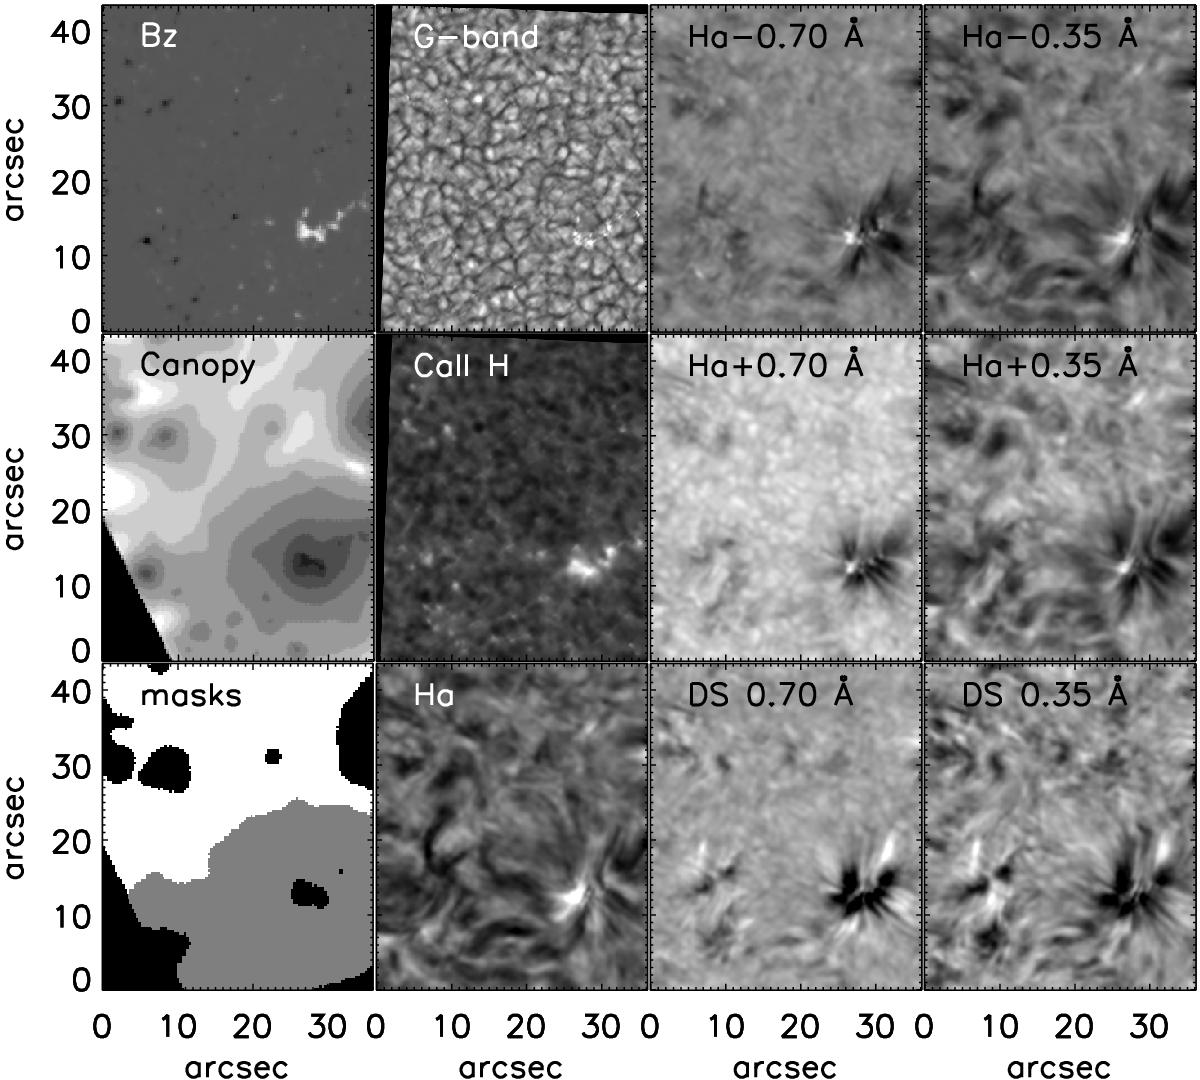
Summary of the observations of the quiet Sun area under study. In the left panel, top row, white denotes positive polarity. In the left panel, middle row, lighter shading denotes higher canopy while canopy heights start at 250 km and increase in 235 km steps. In the left panel, bottom row, white denotes the mask of the IN area, grey the mask of the canopy area while the black regions have not been taken under consideration. Images and DS maps are temporal averages. At the DS maps of the bottom row, white denotes upwards and black denotes downwards motion.
Current usage metrics show cumulative count of Article Views (full-text article views including HTML views, PDF and ePub downloads, according to the available data) and Abstracts Views on Vision4Press platform.
Data correspond to usage on the plateform after 2015. The current usage metrics is available 48-96 hours after online publication and is updated daily on week days.
Initial download of the metrics may take a while.