Fig. 4
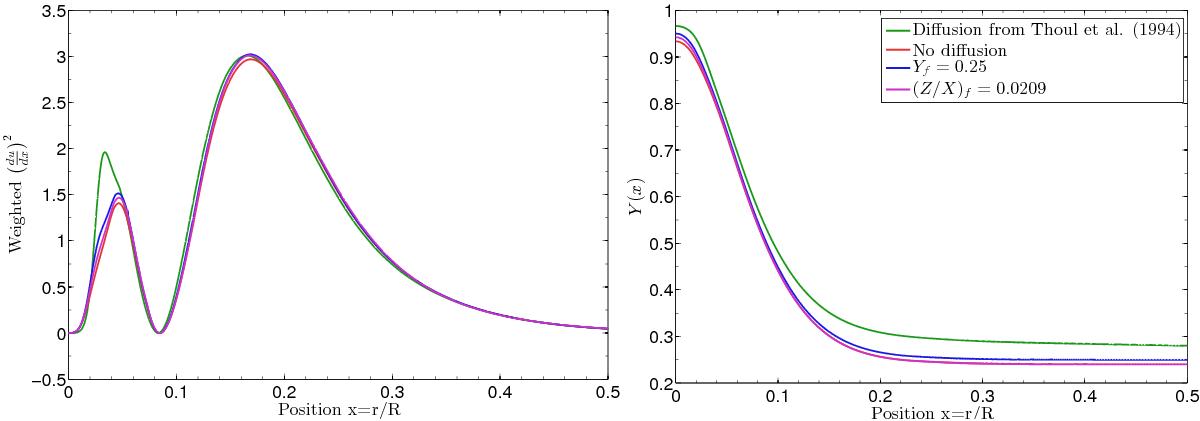
Left panel: effect of diffusion, metallicity changes and helium abundance changes on the core regions for models SA,C1, SA,C2, SA,L1, SA,U1 on the target function of tu. Since the quantity is integrated, the sensitivity is greatly improved. Right panel: the Y(x) profile of these models is illustrated, thus showing the link between tu and chemical composition and thus, its diagnostic potential.
Current usage metrics show cumulative count of Article Views (full-text article views including HTML views, PDF and ePub downloads, according to the available data) and Abstracts Views on Vision4Press platform.
Data correspond to usage on the plateform after 2015. The current usage metrics is available 48-96 hours after online publication and is updated daily on week days.
Initial download of the metrics may take a while.