Fig. 3
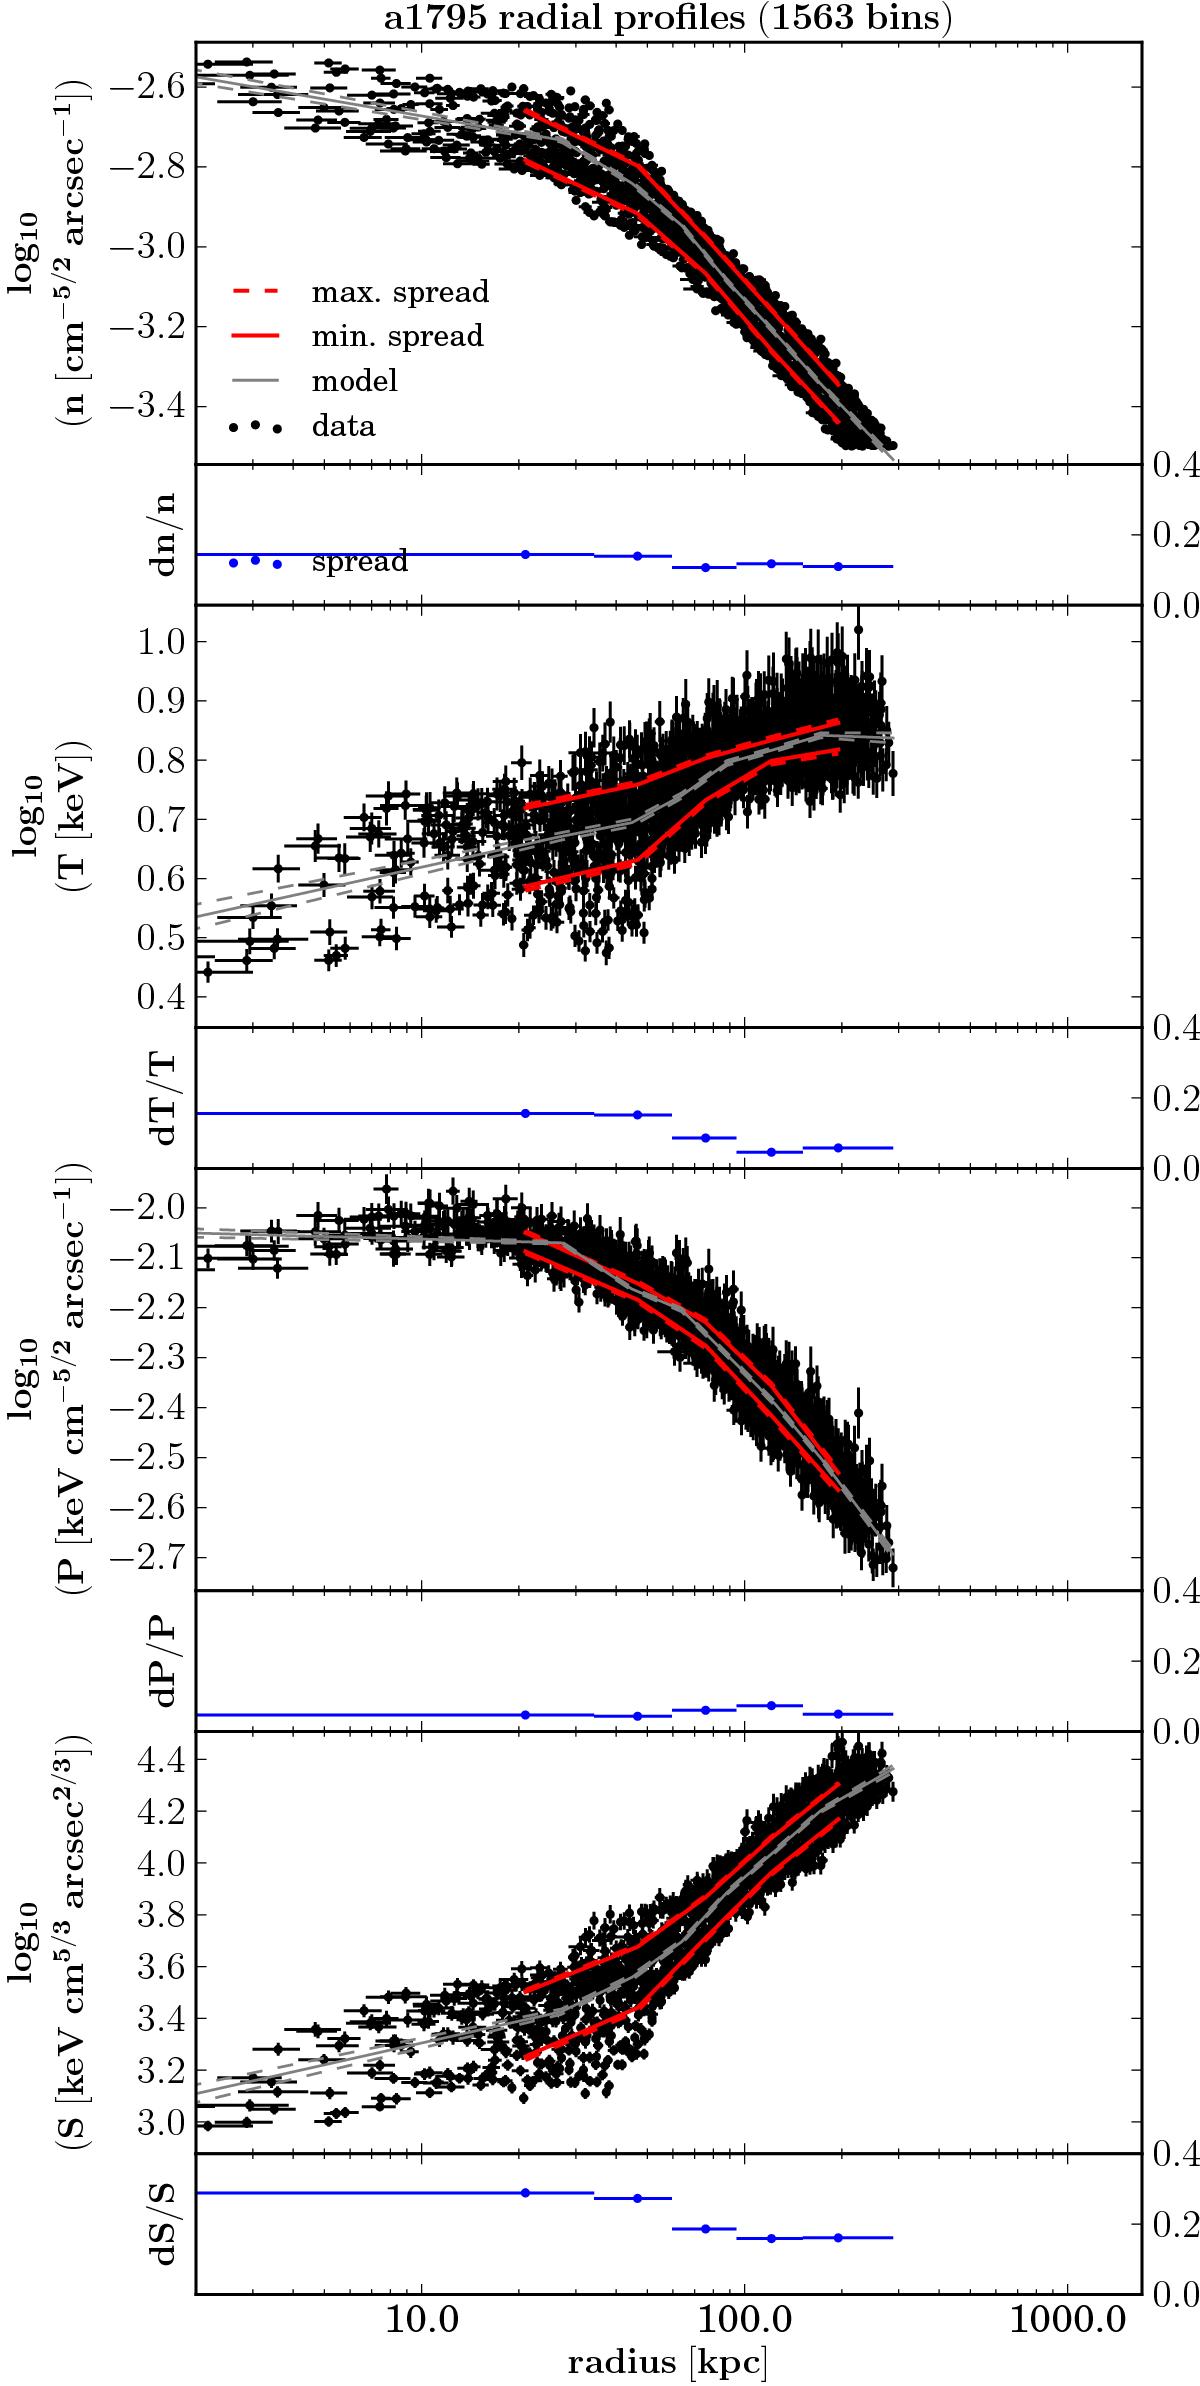
Radial profiles of projected density, temperature, pressure, and entropy of A 1795. The centre is marked by a cross in Fig. 2. Error bars are the fit errors and the standard deviation of the radial distribution of the respective spatial-spectral bin. The plotted lines show limits on intrinsic scatter around an average seven-node model (grey lines) within the given radial range (see Sect. 3.1). The small panels show the measured fractional scatter (M = 5) with confidence and radial range.
Current usage metrics show cumulative count of Article Views (full-text article views including HTML views, PDF and ePub downloads, according to the available data) and Abstracts Views on Vision4Press platform.
Data correspond to usage on the plateform after 2015. The current usage metrics is available 48-96 hours after online publication and is updated daily on week days.
Initial download of the metrics may take a while.