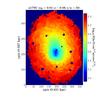
Fig. 2
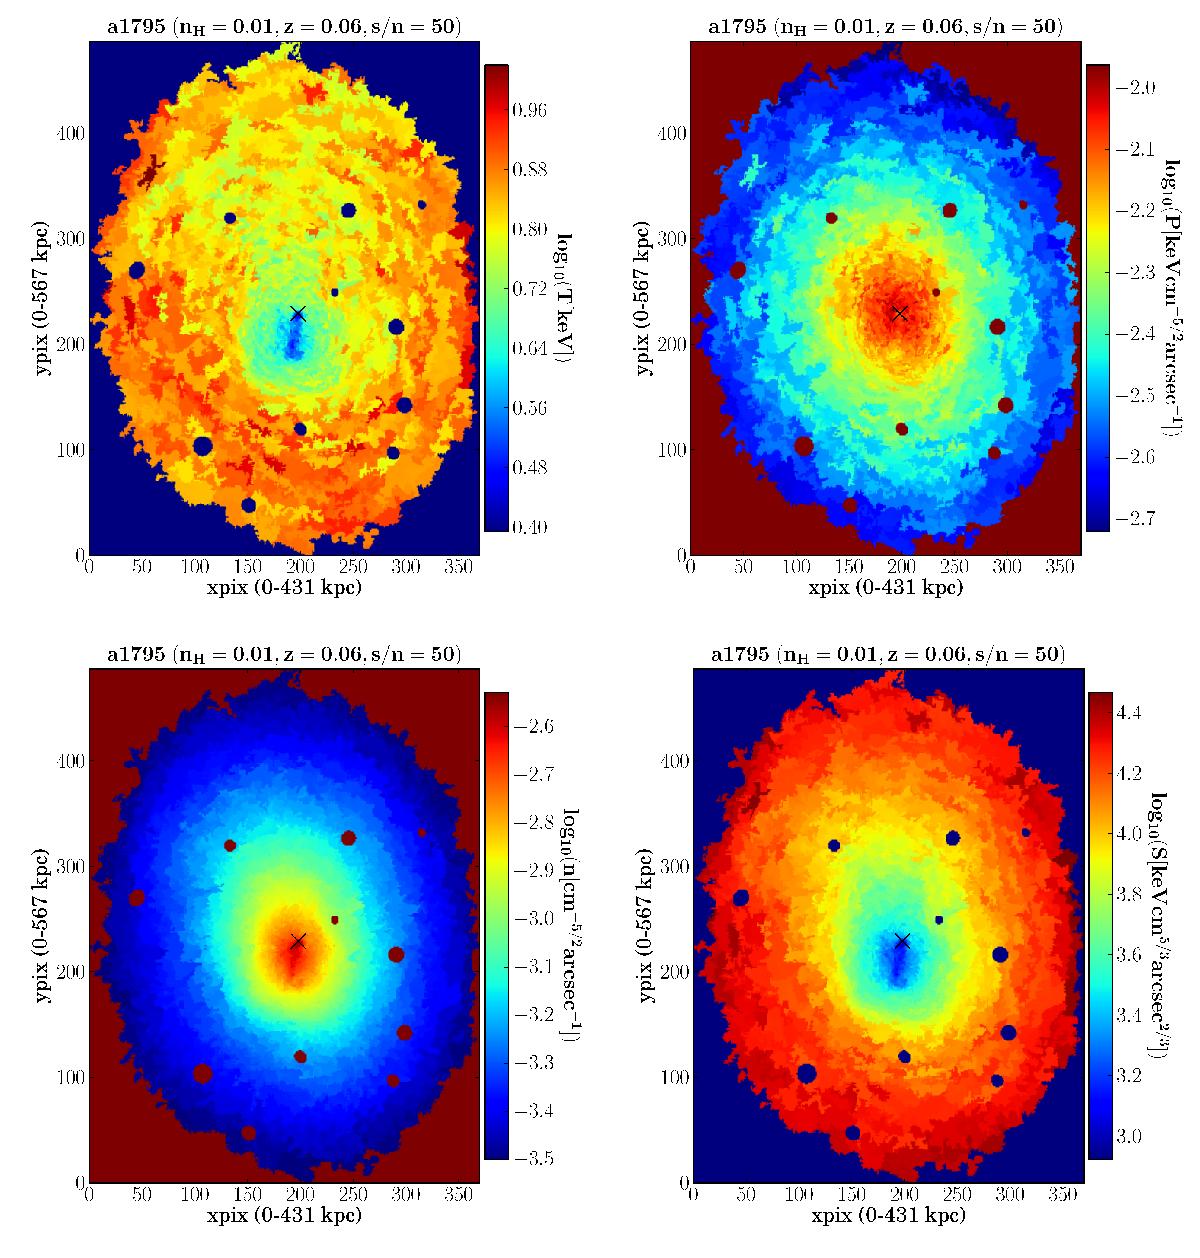
From top left to bottom right: 2D maps of projected temperature, pressure, density, and entropy of A 1795. The cross denotes the X-ray peak and centre for profile analysis. Point sources and regions below the surface brightness cut are set to zero. xpix and ypix are pixels along RA and Dec direction and the overall range in kpc is given. Scale: 1 pix ~ 1″. The plot titles indicate the abbreviated cluster name, the average foreground column density nH [cm-2], and the redshift.
Current usage metrics show cumulative count of Article Views (full-text article views including HTML views, PDF and ePub downloads, according to the available data) and Abstracts Views on Vision4Press platform.
Data correspond to usage on the plateform after 2015. The current usage metrics is available 48-96 hours after online publication and is updated daily on week days.
Initial download of the metrics may take a while.