Fig. E.1
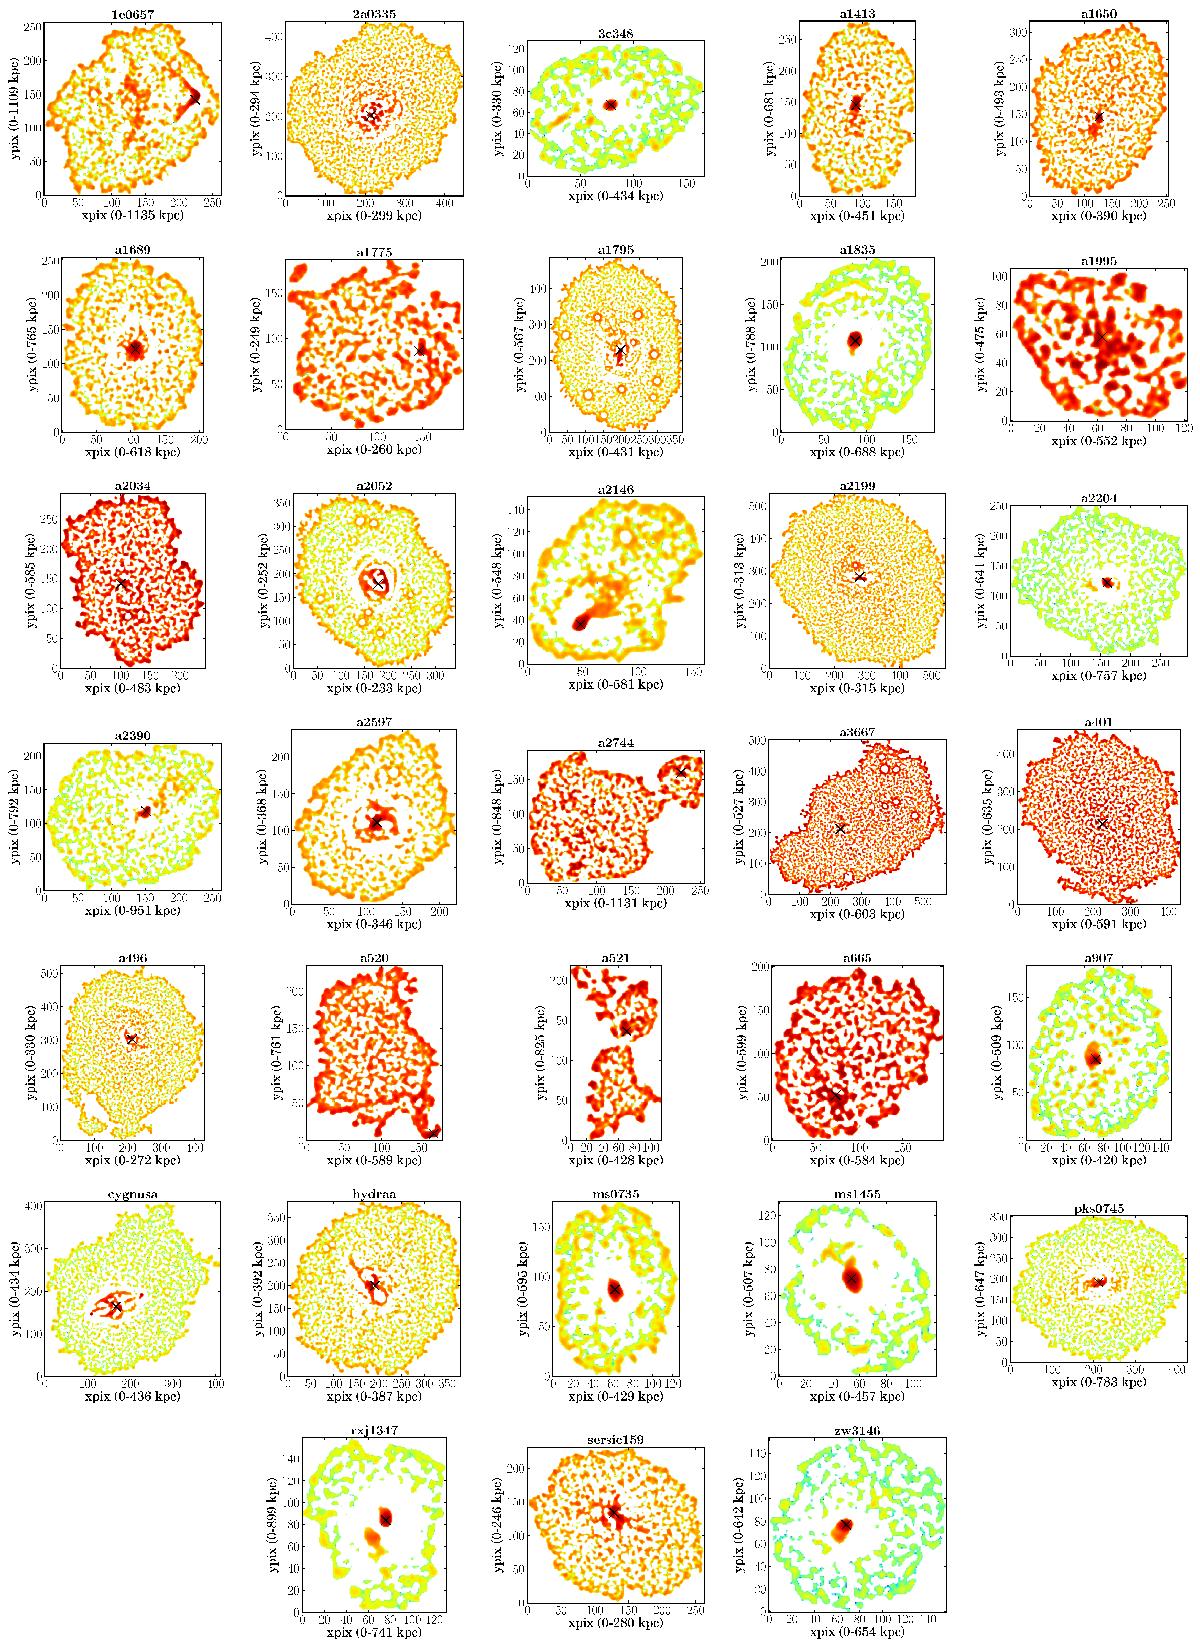
Unsharp-masked exposure-corrected images (logarithmic colour scale) of all clusters in the sample showing the difference between two count images smoothed with a Gaussian function (2 pixels and 5 pixels sigma). Colours indicate relative surface brightness differences (over-densities dark red, under-dense areas green to white). Scale: 1 pix ~ 1″. Crosses mark the peak of the X-ray emission.
Current usage metrics show cumulative count of Article Views (full-text article views including HTML views, PDF and ePub downloads, according to the available data) and Abstracts Views on Vision4Press platform.
Data correspond to usage on the plateform after 2015. The current usage metrics is available 48-96 hours after online publication and is updated daily on week days.
Initial download of the metrics may take a while.