Fig. D.1
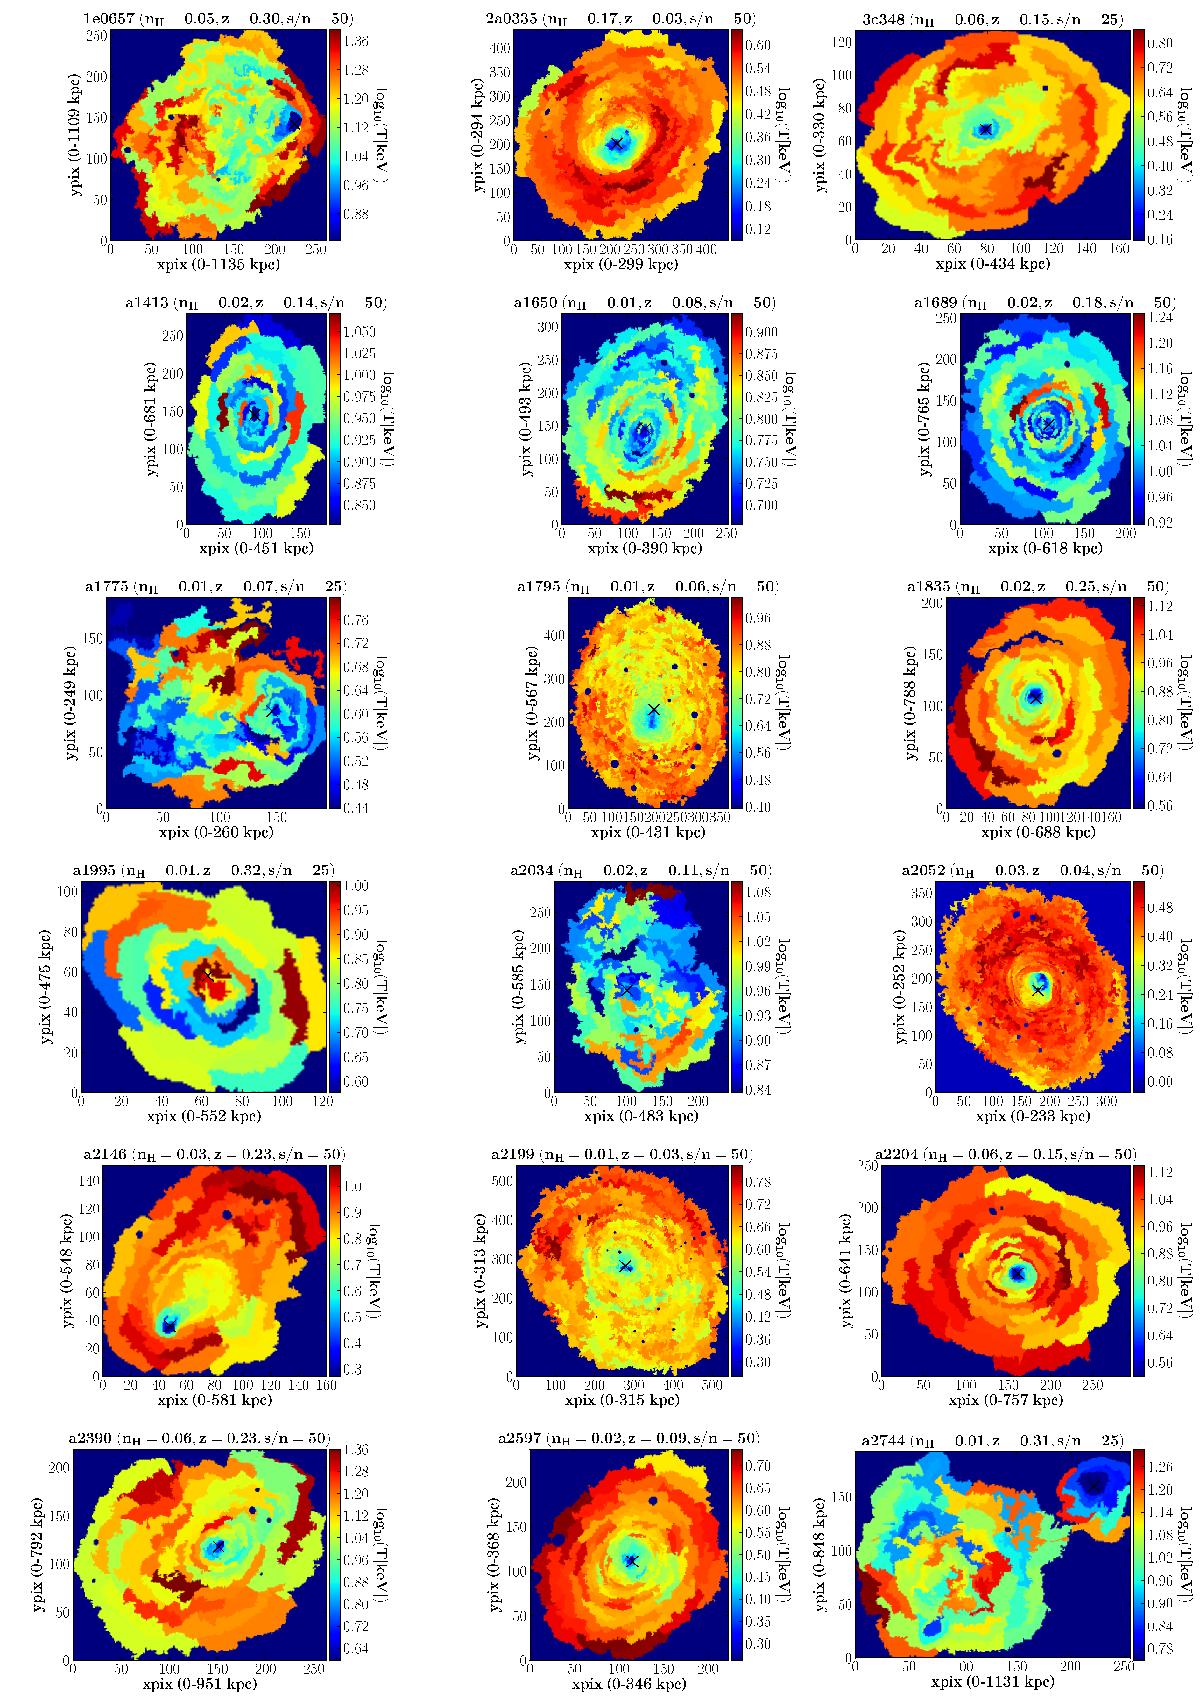
Temperature maps of all clusters in the sample. Bins have a S/N of 50 or 25 (see Sect. 3.1) and temperatures are shown on a logarithmic colour scale. Excluding areas below the surface brightness cut (area-normalised normalisation >10-7 cm-5 arcsec-2) and where the errors on temperature are more than twice the best-fit temperature value. The plot title gives the abbreviated cluster name, the average foreground column density nH [cm-2], and the redshift z. Scale: 1 pix ~ 1″. Crosses denote the peak of X-ray emission.
Current usage metrics show cumulative count of Article Views (full-text article views including HTML views, PDF and ePub downloads, according to the available data) and Abstracts Views on Vision4Press platform.
Data correspond to usage on the plateform after 2015. The current usage metrics is available 48-96 hours after online publication and is updated daily on week days.
Initial download of the metrics may take a while.