Fig. 10
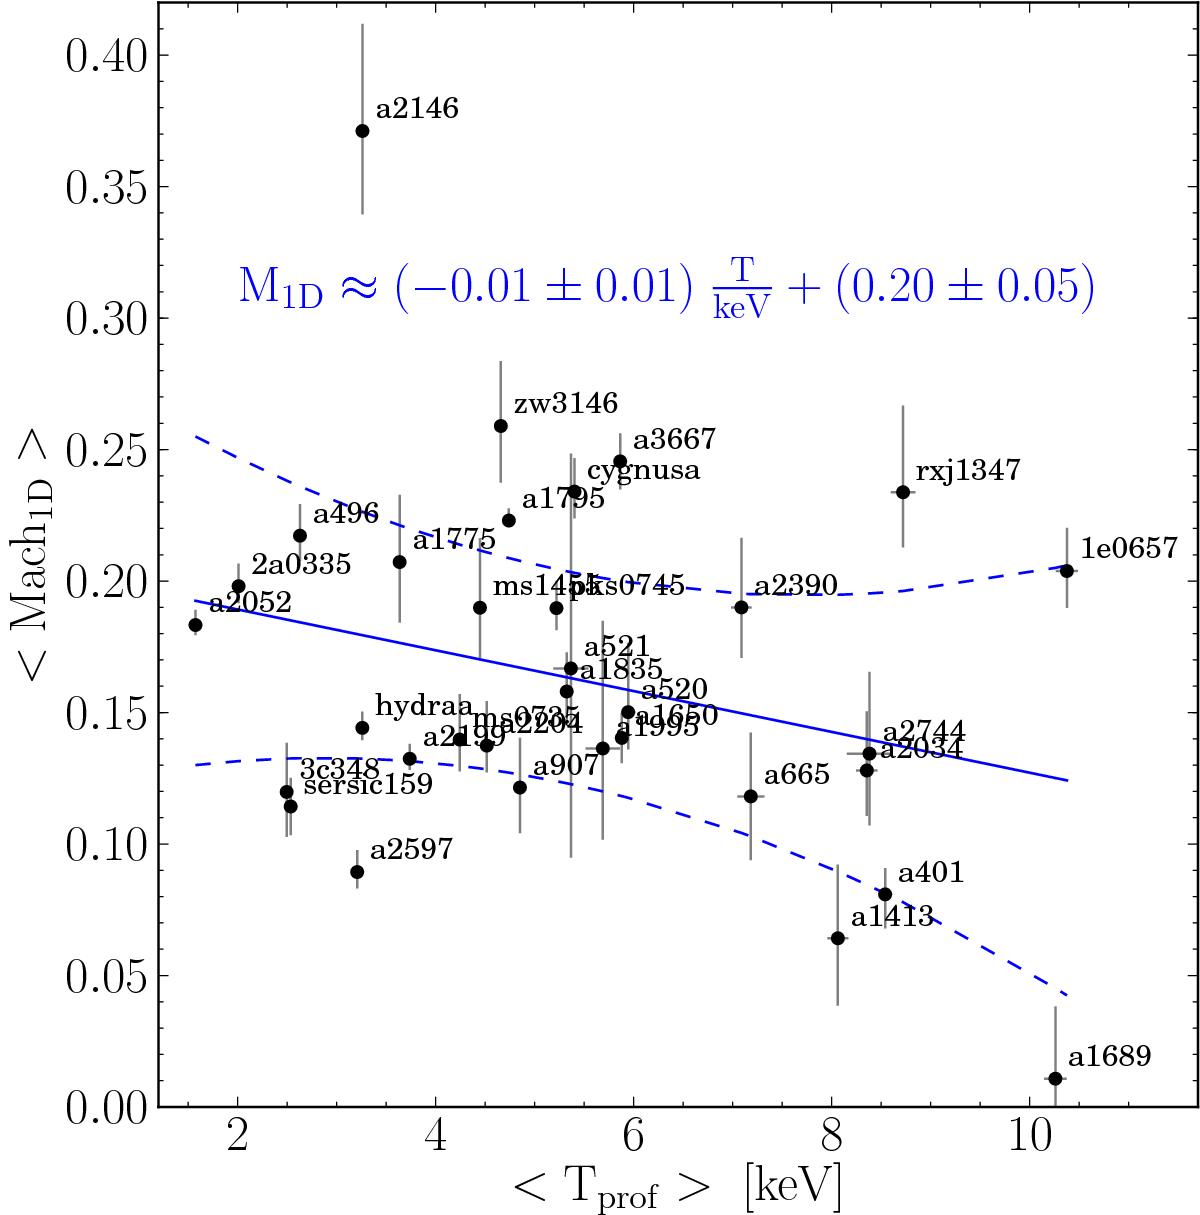
Relation between the average cluster temperature ⟨ T prof ⟩ and the fractional spread value of the dominating perturbation (dS or dP), which is proportional to the 1D Mach number. The solid and dashed lines represent the best linear correlation and its 1σ scatter. Error bars are the statistical uncertainty from the MCMC measurements.
Current usage metrics show cumulative count of Article Views (full-text article views including HTML views, PDF and ePub downloads, according to the available data) and Abstracts Views on Vision4Press platform.
Data correspond to usage on the plateform after 2015. The current usage metrics is available 48-96 hours after online publication and is updated daily on week days.
Initial download of the metrics may take a while.