Fig. 8
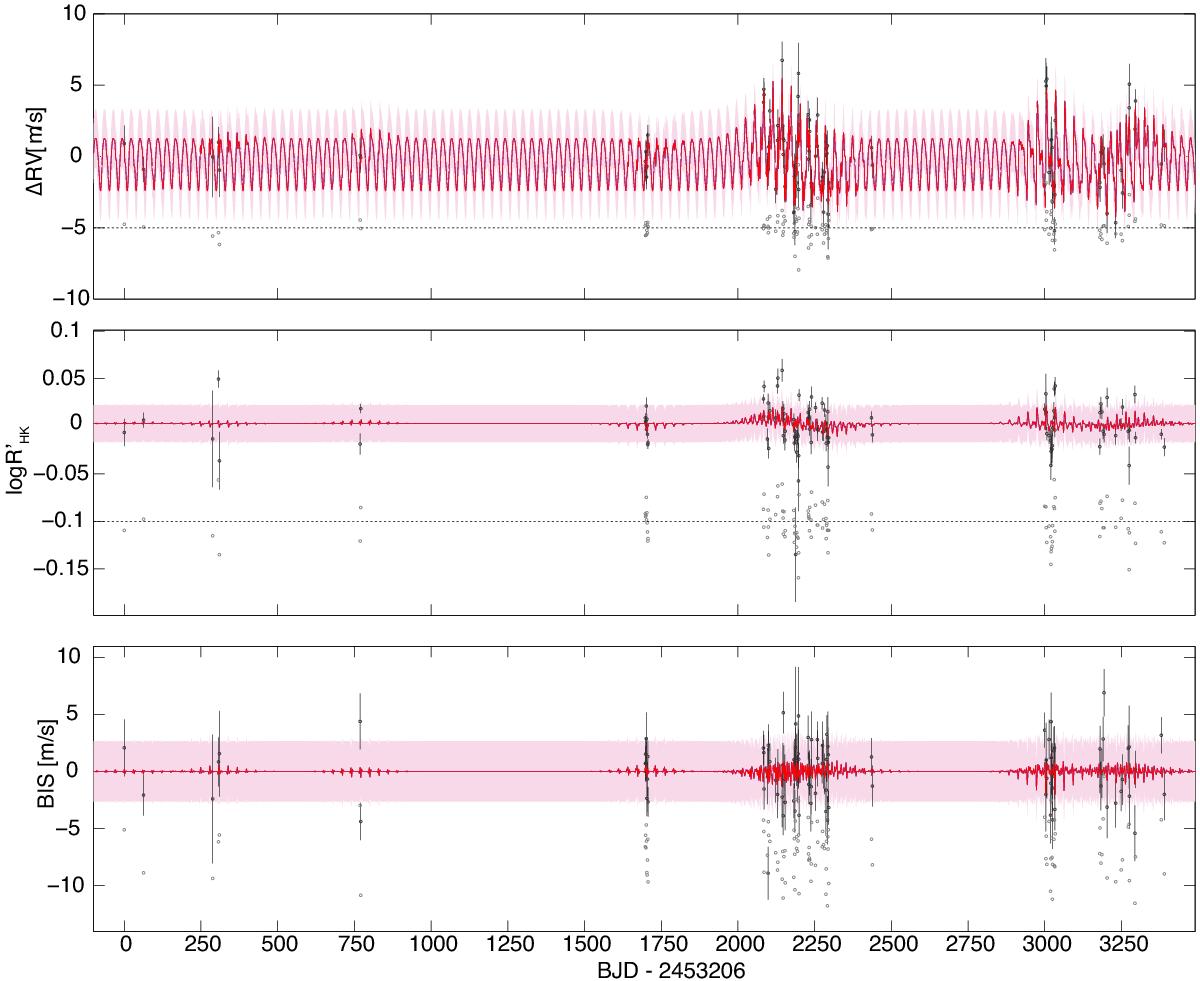
GP model MAP fit to the HD 175607 data. The 110 observations in each time series were fit simultaneously, i.e. using a single set of (hyper)parameters. The dots indicate observed data, with estimated errors; solid lines are model posterior means; and shaded regions denote ± σ posterior uncertainty. Residuals are plotted below the observed data and fitted model, but for the sake of clarity, with an arbitrary vertical offset from the main time series.
Current usage metrics show cumulative count of Article Views (full-text article views including HTML views, PDF and ePub downloads, according to the available data) and Abstracts Views on Vision4Press platform.
Data correspond to usage on the plateform after 2015. The current usage metrics is available 48-96 hours after online publication and is updated daily on week days.
Initial download of the metrics may take a while.