Free Access
Fig. 2
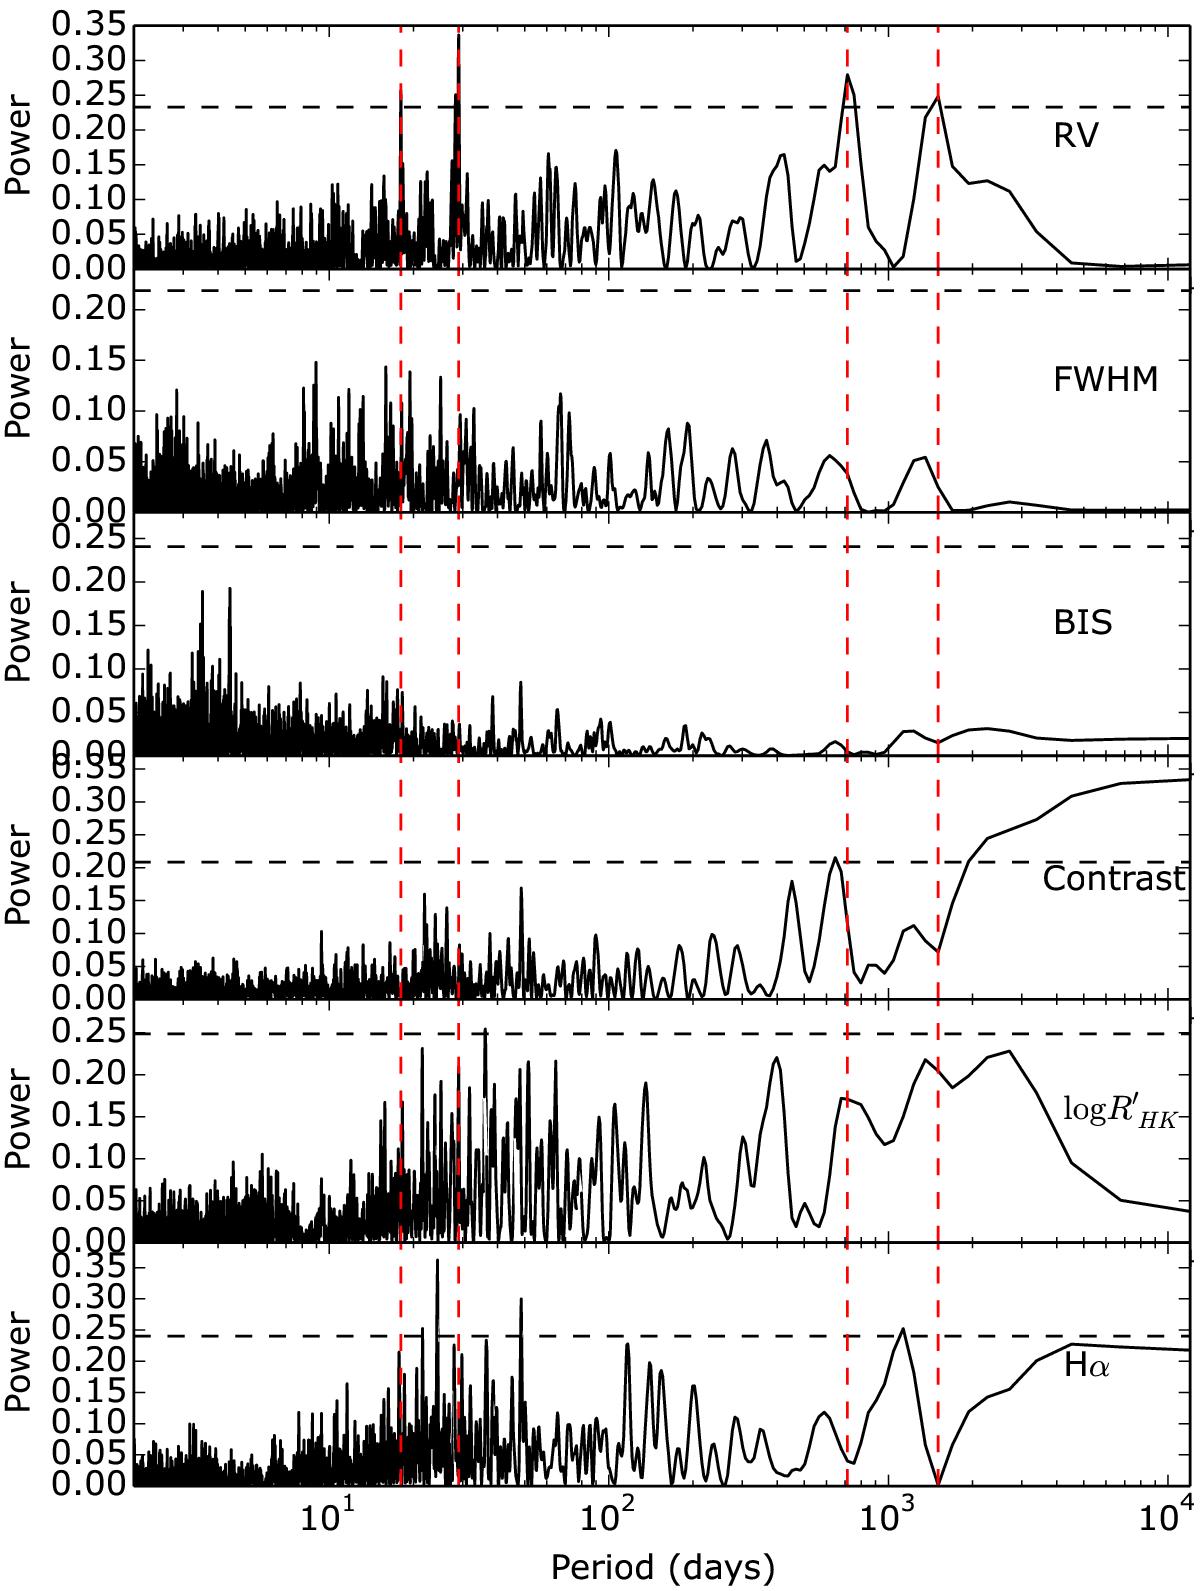
Top to bottom: GLS periodograms of the radial velocities, FWHM, BIS, contrast, ![]() , and Hα index. The horizontal black dashed lines represent the 1% FAP. The vertical red dashed lines appear at the periods of the four significant peaks in the RV periodogram.
, and Hα index. The horizontal black dashed lines represent the 1% FAP. The vertical red dashed lines appear at the periods of the four significant peaks in the RV periodogram.
Current usage metrics show cumulative count of Article Views (full-text article views including HTML views, PDF and ePub downloads, according to the available data) and Abstracts Views on Vision4Press platform.
Data correspond to usage on the plateform after 2015. The current usage metrics is available 48-96 hours after online publication and is updated daily on week days.
Initial download of the metrics may take a while.