Fig. 2
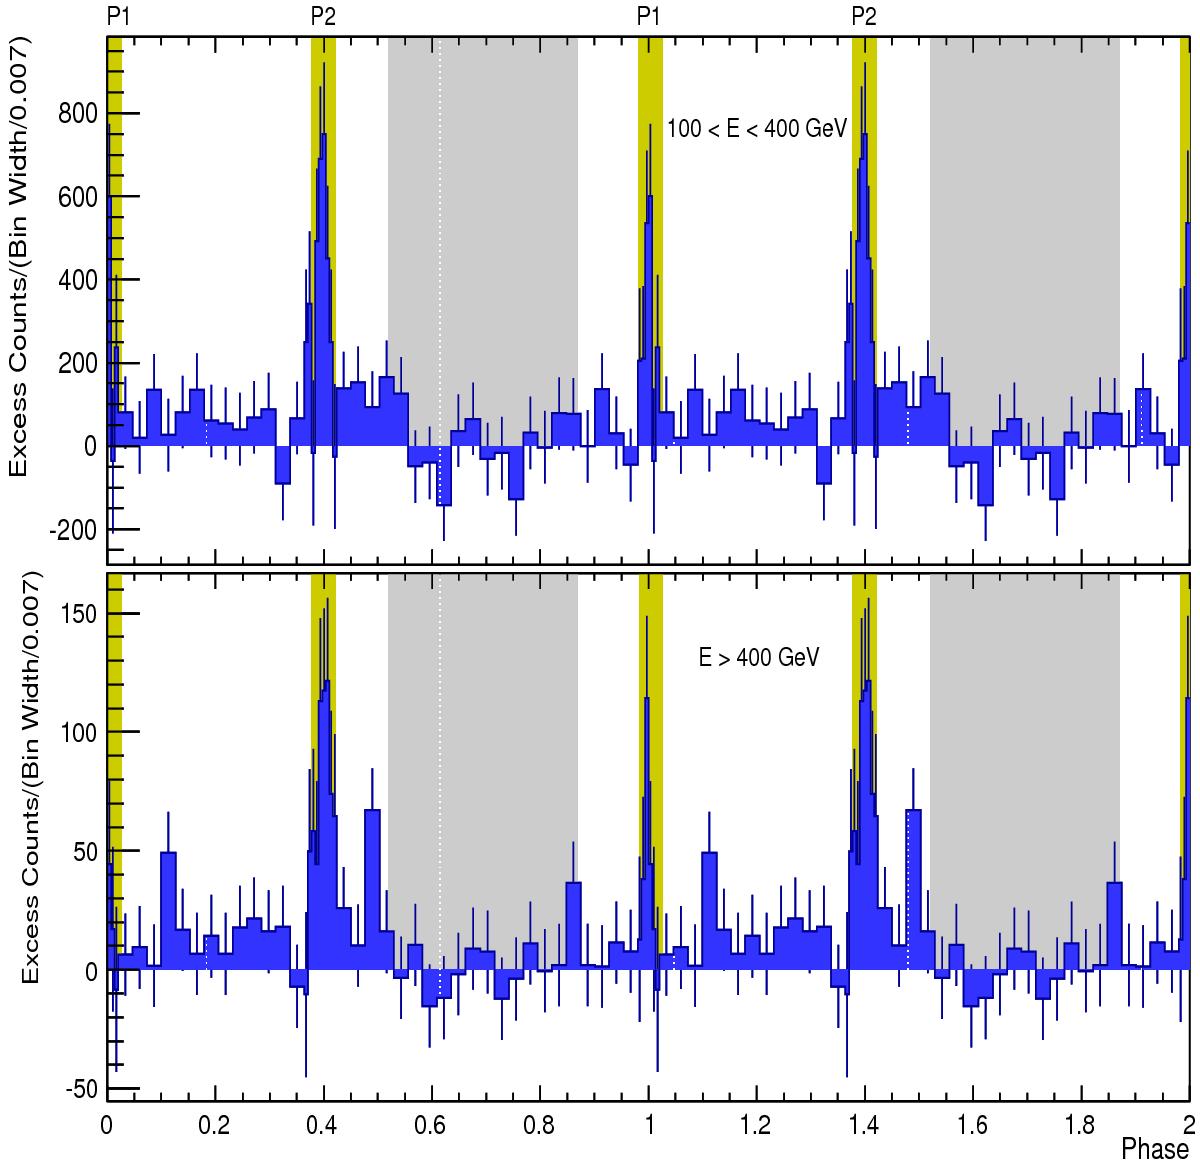
Pulse profile of the Crab Pulsar between 100 and 400 GeV (upper panel) and above 400 GeV (bottom panel). The pulse profile, shown twice for clarity, is background subtracted. The bin width around the two peaks is 4 times smaller (0.007) than the rest (0.027) in order to highlight the sharpness of the peaks. Yellow dashed areas identify the phase intervals of the two peaks, whereas the gray areas show the off-pulse region.
Current usage metrics show cumulative count of Article Views (full-text article views including HTML views, PDF and ePub downloads, according to the available data) and Abstracts Views on Vision4Press platform.
Data correspond to usage on the plateform after 2015. The current usage metrics is available 48-96 hours after online publication and is updated daily on week days.
Initial download of the metrics may take a while.