Free Access
Fig. 14
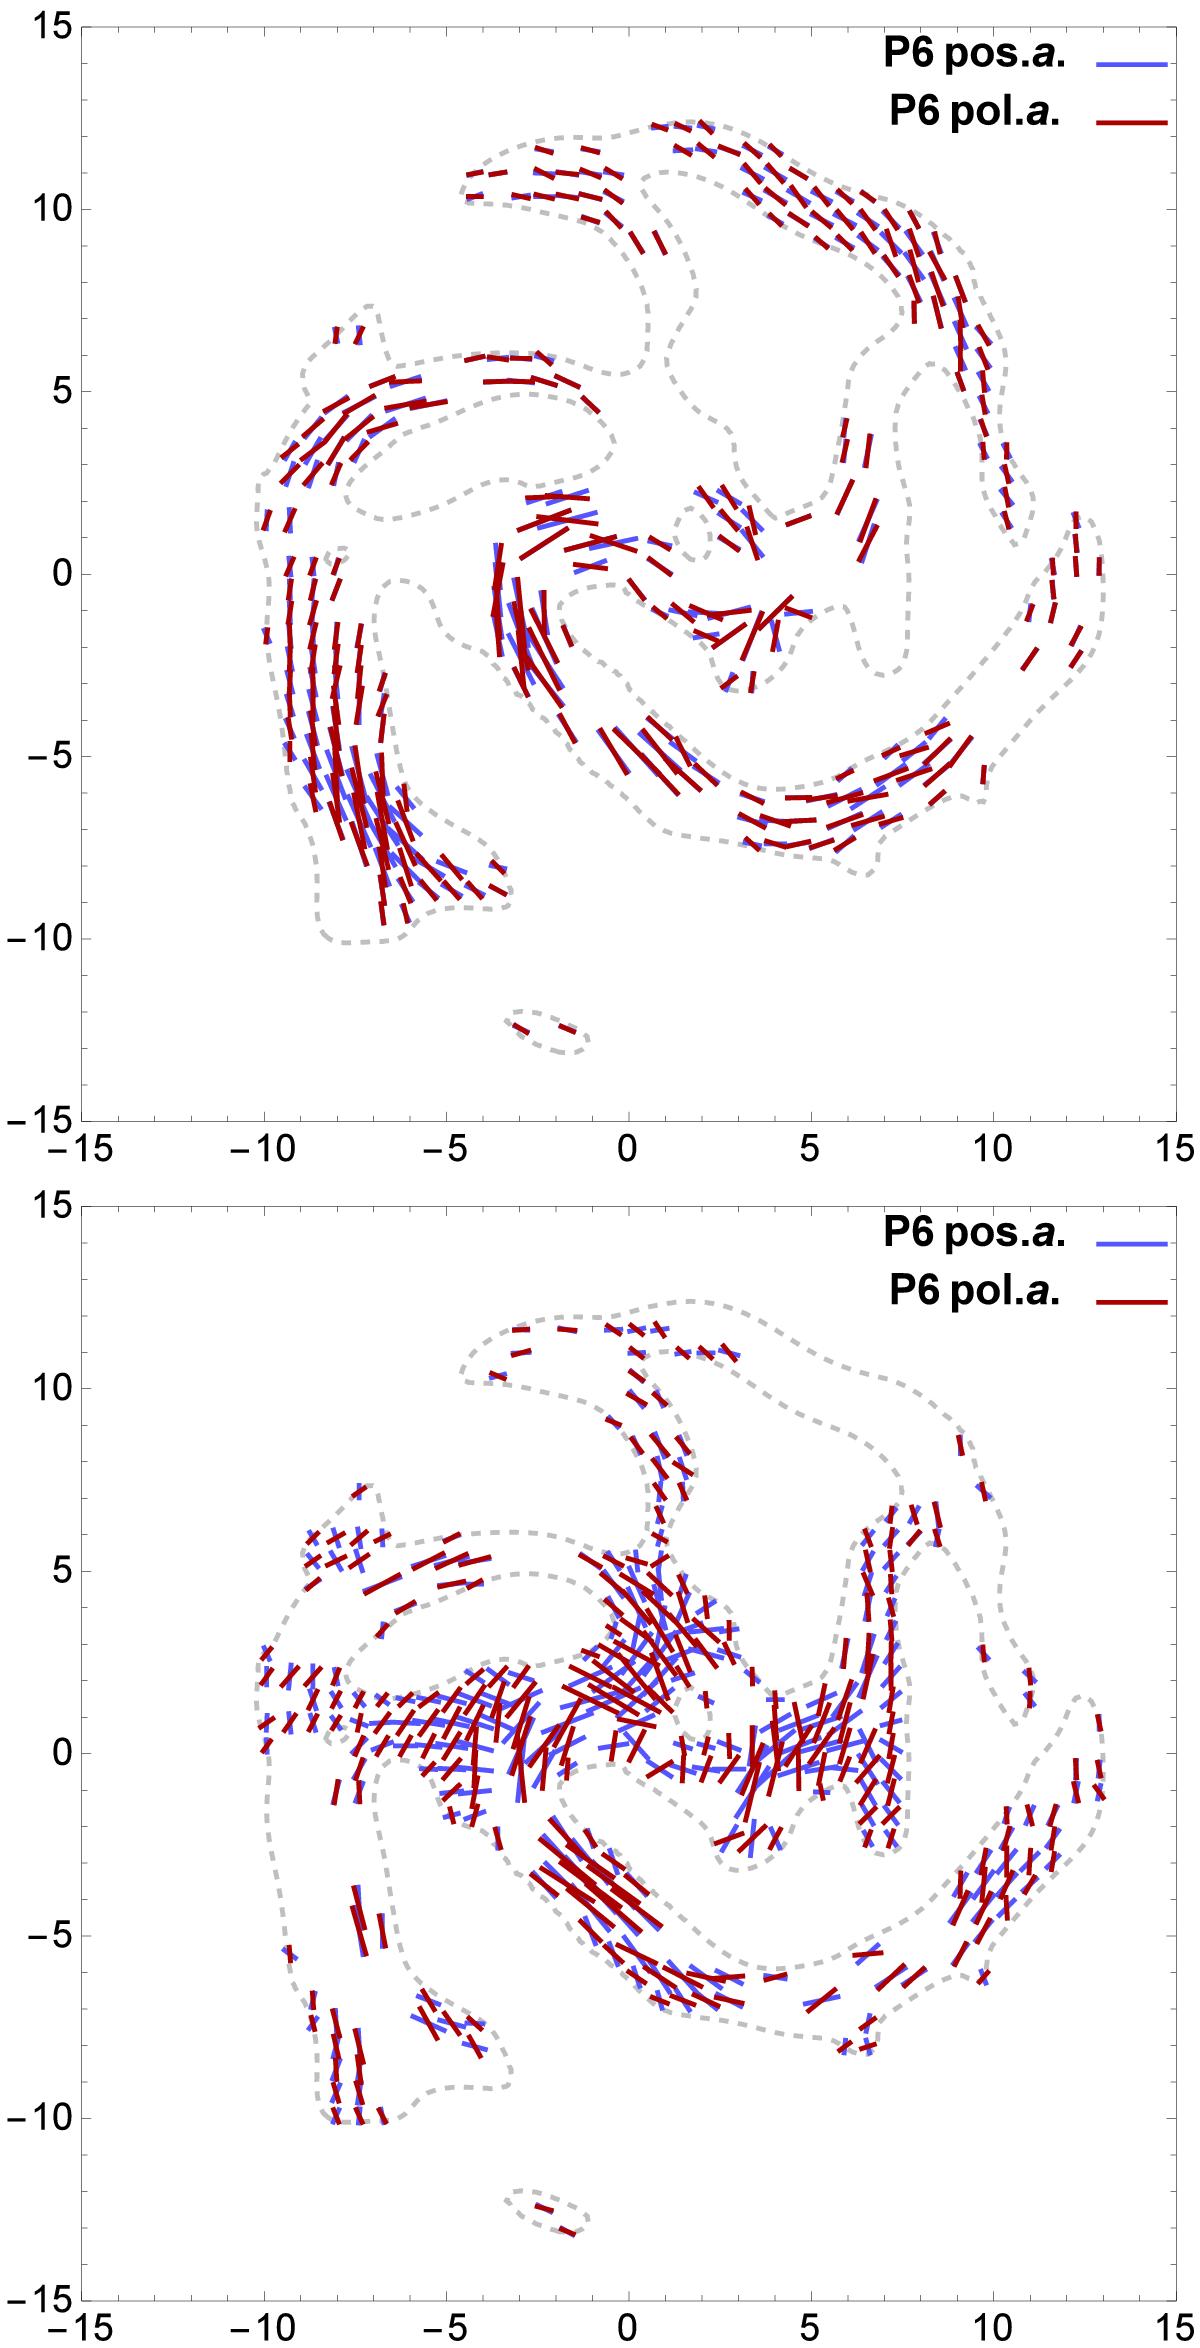
As in Fig. 13, but with blue bars showing the position angles of the structures of the polarized intensity P6, the isocontour of P6 at 20% of its maximum intensity shown as dashed. The upper and lower panels show data points with the difference between the angles in the range −1° to 29° and out of this range, respectively.
Current usage metrics show cumulative count of Article Views (full-text article views including HTML views, PDF and ePub downloads, according to the available data) and Abstracts Views on Vision4Press platform.
Data correspond to usage on the plateform after 2015. The current usage metrics is available 48-96 hours after online publication and is updated daily on week days.
Initial download of the metrics may take a while.