Fig. 6
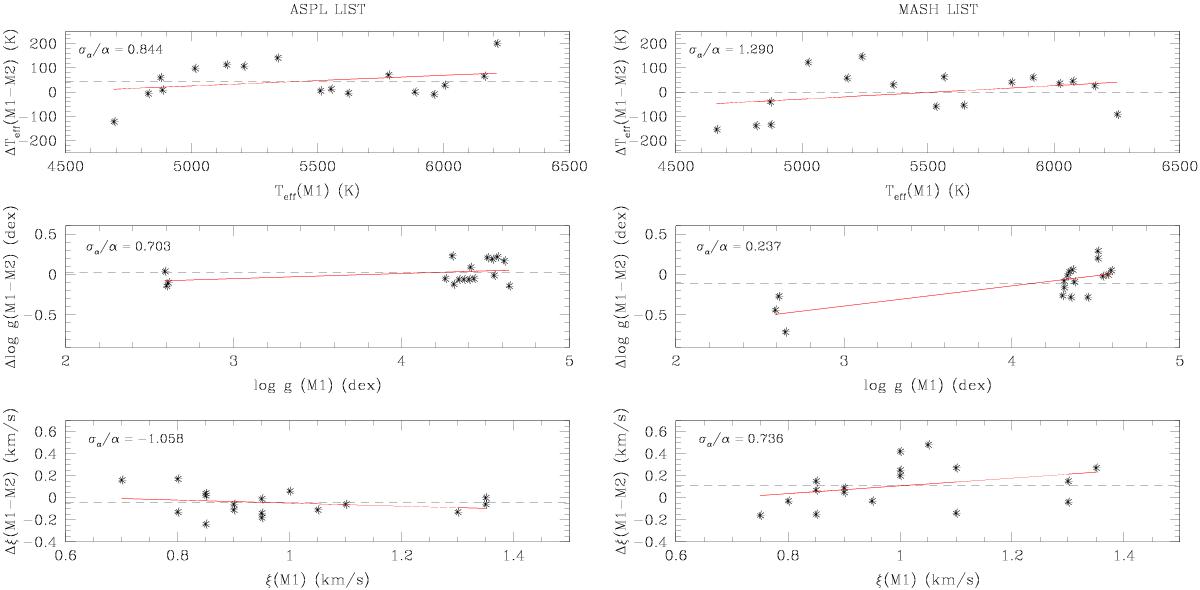
Comparison of the atmospheric parameters obtained with methods M1 and M2, as a function of the M1 parameters. The red lines are the linear regressions between the values. The dashed lines are the mean of the difference between the values presented in the y-axis. Left: parameters obtained with the ASPL line list. Right: parameters obtained with the MASH line list.
Current usage metrics show cumulative count of Article Views (full-text article views including HTML views, PDF and ePub downloads, according to the available data) and Abstracts Views on Vision4Press platform.
Data correspond to usage on the plateform after 2015. The current usage metrics is available 48-96 hours after online publication and is updated daily on week days.
Initial download of the metrics may take a while.