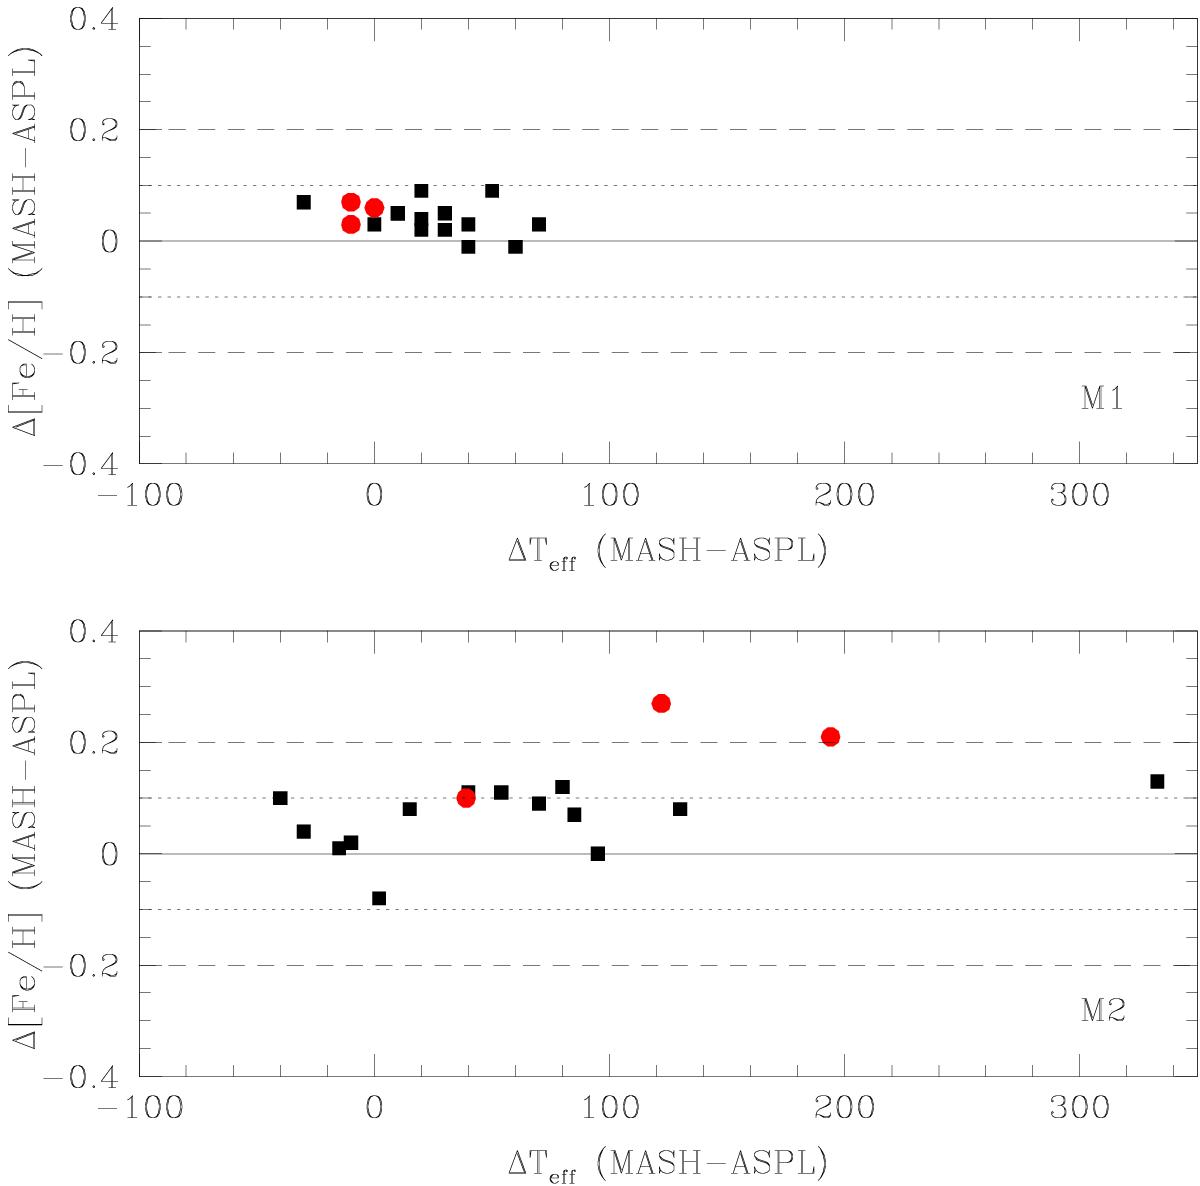
Fig. 5

Comparison of the metallicity scale derived with lists MASH and ASPL as a function of the Teff obtained with ASPL list for M1 (upper panel) and M2 (lower panel). In each plot, the null, ±0.1 and ±0.2 abundance differences are represented by the continuous, the dotted and the dashed lines respectively. Red dots refer to the giants while black squares refer to the dwarfs.
Current usage metrics show cumulative count of Article Views (full-text article views including HTML views, PDF and ePub downloads, according to the available data) and Abstracts Views on Vision4Press platform.
Data correspond to usage on the plateform after 2015. The current usage metrics is available 48-96 hours after online publication and is updated daily on week days.
Initial download of the metrics may take a while.


