Fig. 4
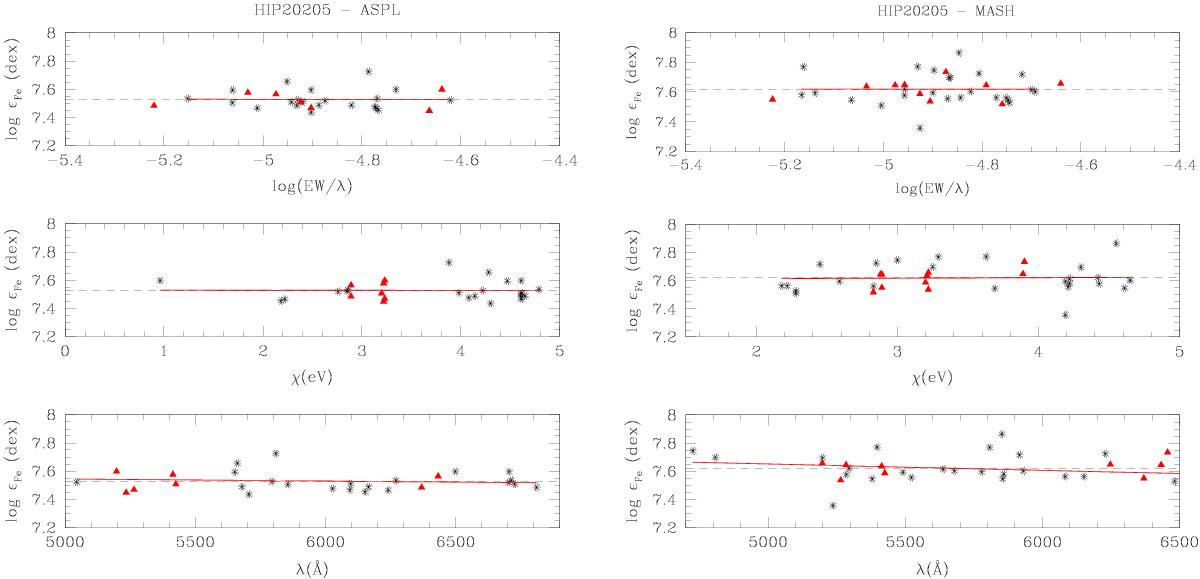
Fe i and Fe ii abundances as a function of the excitation potential (χ), the logarithm of the reduced EW and the wavelength. The continuous red line is the regression between the quantities shown in each plot. The dashed line corresponds to the Fe ii final abundance derived according to M2. In all plots, the black asterisks correspond to the Fe i lines and the red filled triangles correspond to the Fe ii lines. Left: spectroscopic analysis for HIP 20205 using ASPL list. Right: spectroscopic analysis for HIP 20205 using MASH list.
Current usage metrics show cumulative count of Article Views (full-text article views including HTML views, PDF and ePub downloads, according to the available data) and Abstracts Views on Vision4Press platform.
Data correspond to usage on the plateform after 2015. The current usage metrics is available 48-96 hours after online publication and is updated daily on week days.
Initial download of the metrics may take a while.