Fig. 2
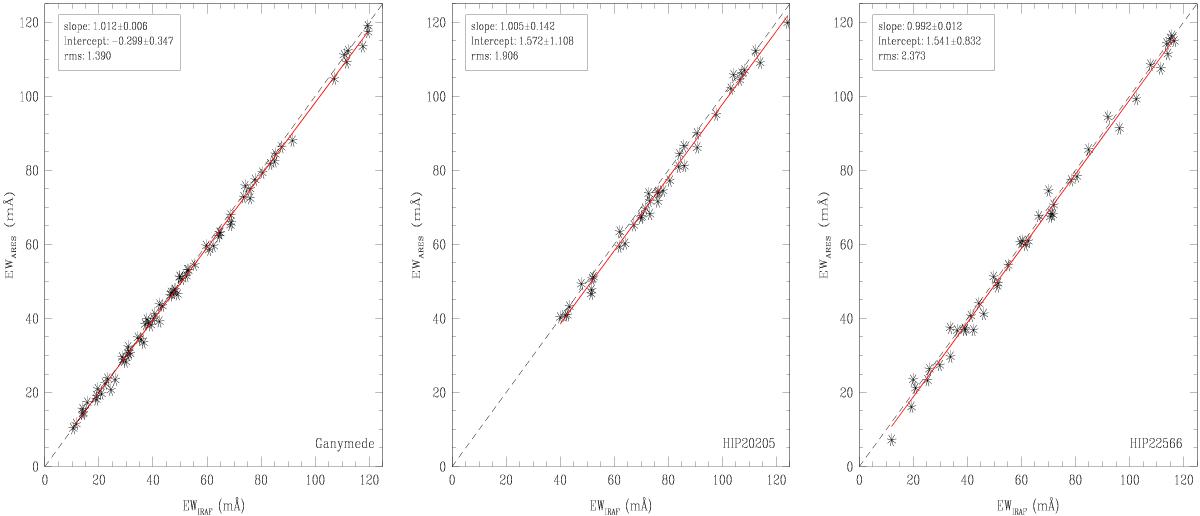
Comparison of EWs obtained with ARES and splot. Left: the solar reflected spectrum of Ganymede; middle: the star HIP 20205; and right: the star HIP 22566. The one-to-one relation is shown with the dashed line, and the red line represents the linear regression fit in each plot. The slope, the intercept, and the rms of the fits are also given in each plot.
Current usage metrics show cumulative count of Article Views (full-text article views including HTML views, PDF and ePub downloads, according to the available data) and Abstracts Views on Vision4Press platform.
Data correspond to usage on the plateform after 2015. The current usage metrics is available 48-96 hours after online publication and is updated daily on week days.
Initial download of the metrics may take a while.