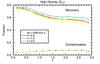
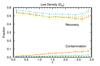
Fig. 5
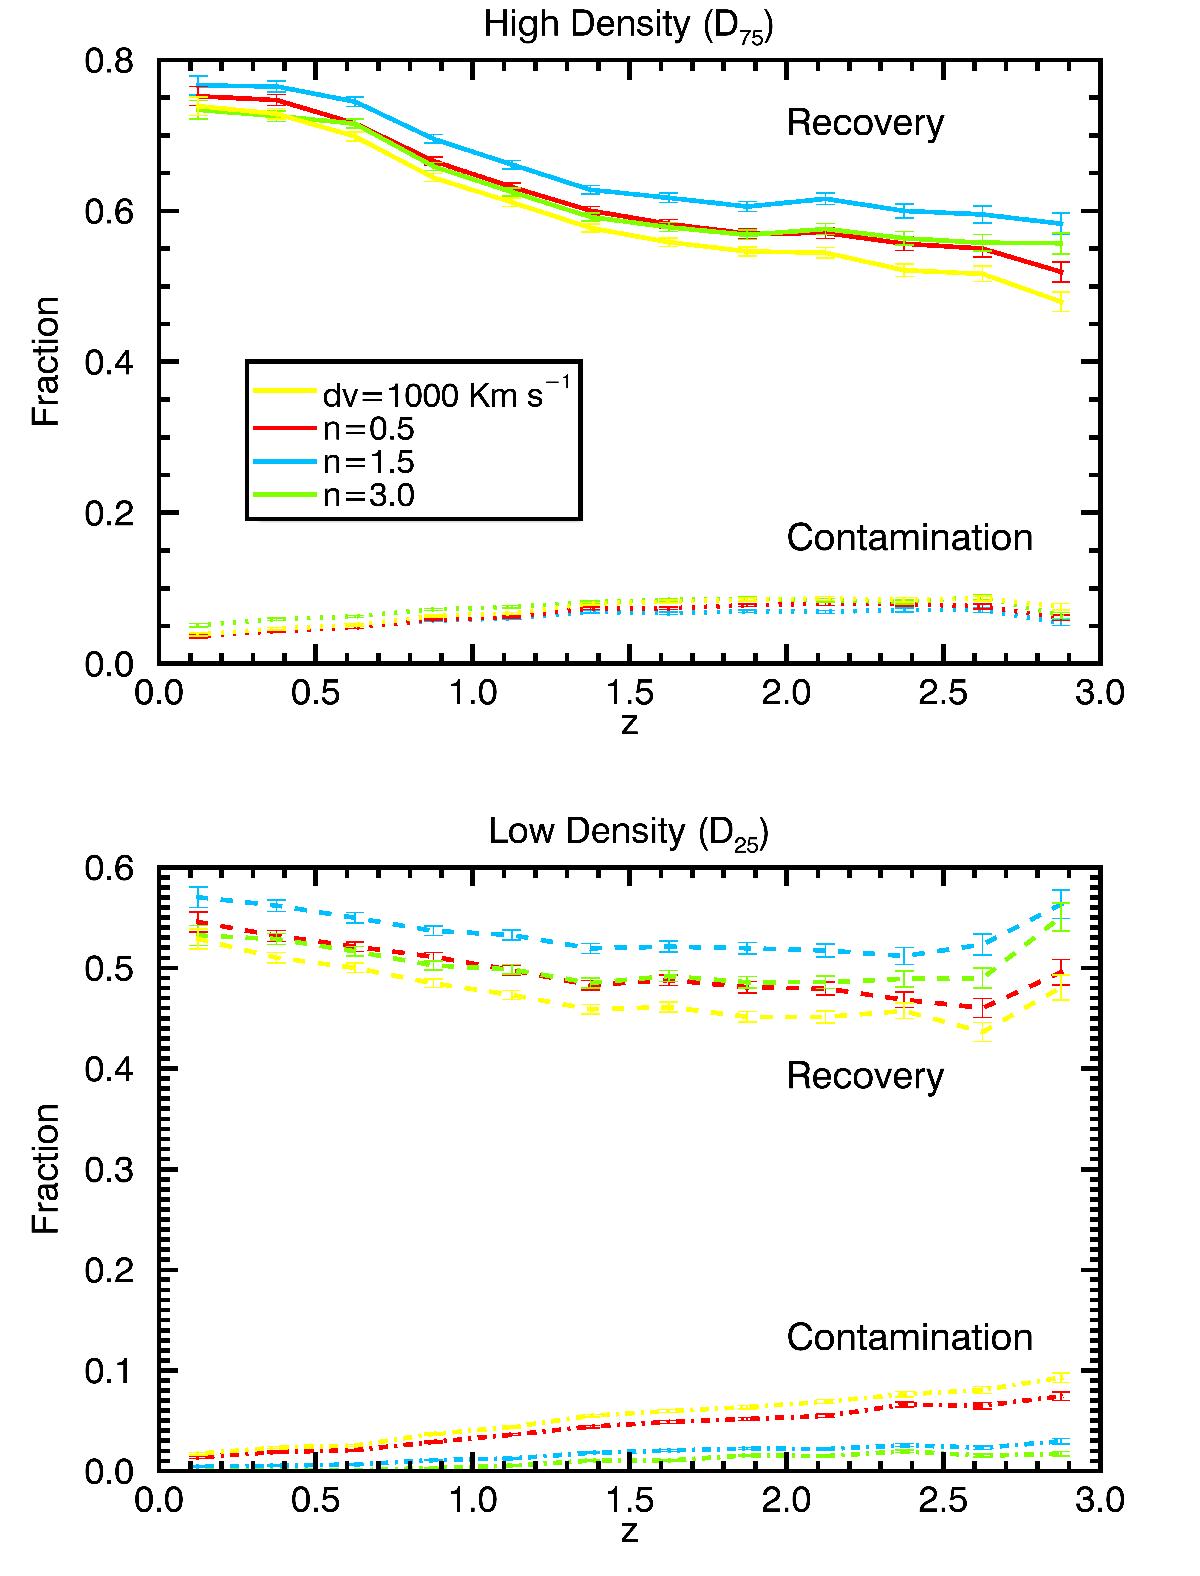
Recovery and contamination fractions – varying n. fRec (solid and dashed lines) and fCon (dotted and dot-dashed lines) as a function of redshift. Bottom panel refers to low-density environments, while top panel refers to high-density environments. The various curves are colour-coded according to the various values of n (yellow: dv = 1000 km s-1; red: n = 0.5; cyan: n = 1.5; and green: n = 3). The radius has been fixed to RT = RR = 1 Mpc and the uncertainty in the photometric redshift is σΔz/ (1 + z) = 0.01. There is a different scale on the ordinate axis between high-density and low-density environments.
Current usage metrics show cumulative count of Article Views (full-text article views including HTML views, PDF and ePub downloads, according to the available data) and Abstracts Views on Vision4Press platform.
Data correspond to usage on the plateform after 2015. The current usage metrics is available 48-96 hours after online publication and is updated daily on week days.
Initial download of the metrics may take a while.