Fig. 4
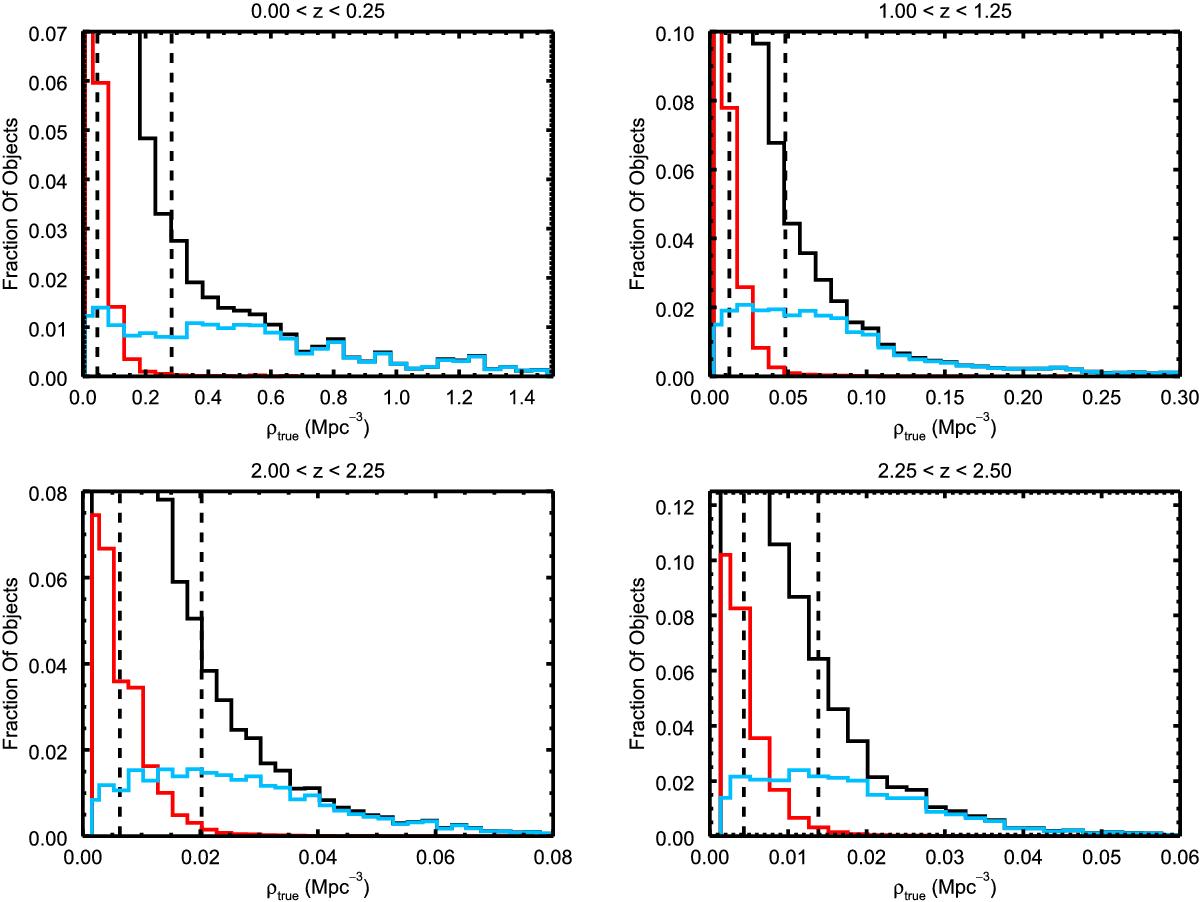
Distributions comparison. Distribution in terms of ϱtrue of the high-density and low-density samples, identified using ϱrec in four representative redshift bins (labelled on top of each plot). In particular, the black histogram is the ϱtrue distribution shown as a reference, the cyan histogram refers to D75ϱrec, while the red histogram refers to D25ϱrec. The environmental estimate has been performed with n = 1.5, R = 1 Mpc and σΔz/ (1 + z) = 0.01. The two vertical dashed lines are the values of environmental density corresponding to the 25th and 75th percentile of the ϱtrue distribution.
Current usage metrics show cumulative count of Article Views (full-text article views including HTML views, PDF and ePub downloads, according to the available data) and Abstracts Views on Vision4Press platform.
Data correspond to usage on the plateform after 2015. The current usage metrics is available 48-96 hours after online publication and is updated daily on week days.
Initial download of the metrics may take a while.