Fig. 2
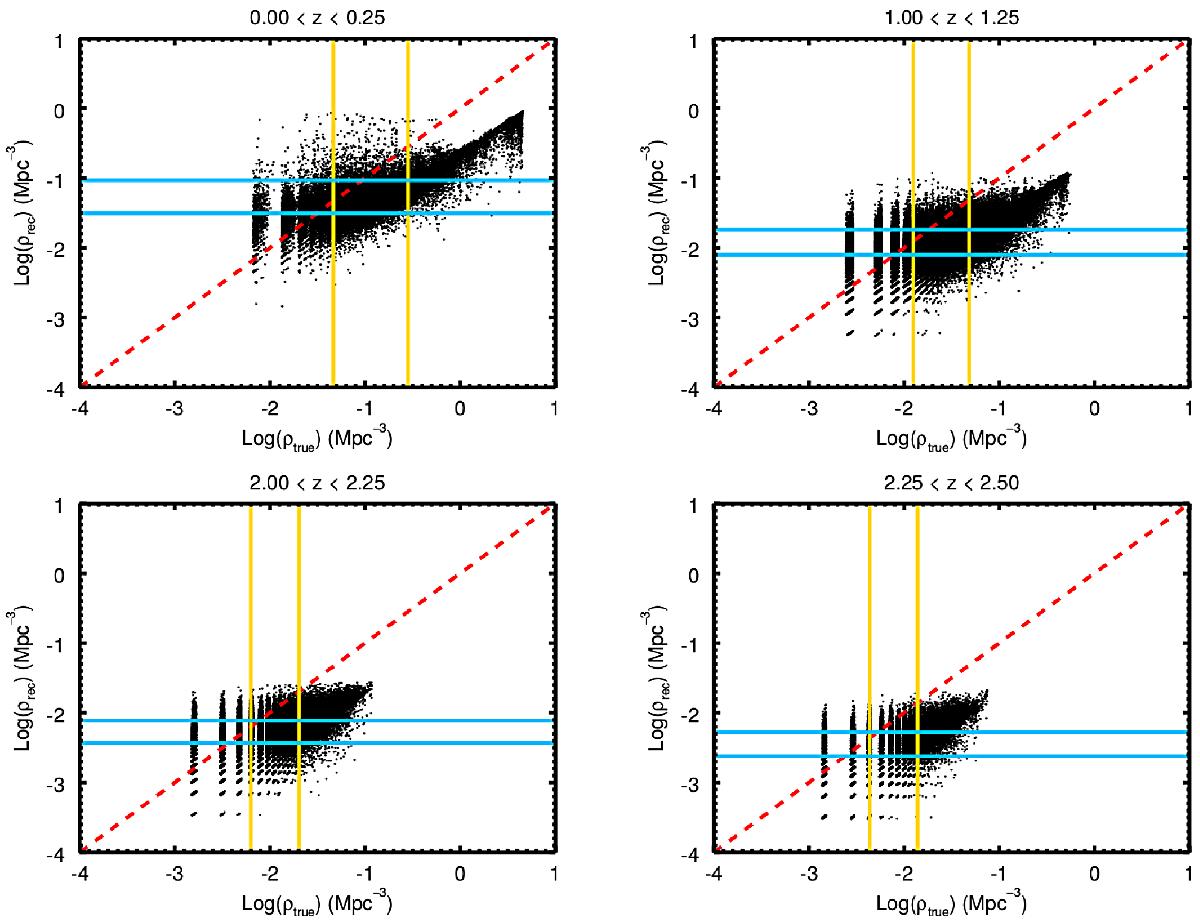
Environment comparison. Comparison between ϱtrue and ϱrec (black points) in four representative redshift bins, labelled on top of each plot. Cyan horizontal lines represent the quartiles of the ϱrec distribution, while yellow vertical lines are the quartiles of the ϱtrue distribution. The 1:1 relation is reported as a red dashed line for reference. Parameters used in the environmental estimate are R = 1 Mpc, n = 1.5 and σΔz/ (1 + z) = 0.01.
Current usage metrics show cumulative count of Article Views (full-text article views including HTML views, PDF and ePub downloads, according to the available data) and Abstracts Views on Vision4Press platform.
Data correspond to usage on the plateform after 2015. The current usage metrics is available 48-96 hours after online publication and is updated daily on week days.
Initial download of the metrics may take a while.