Fig. 15
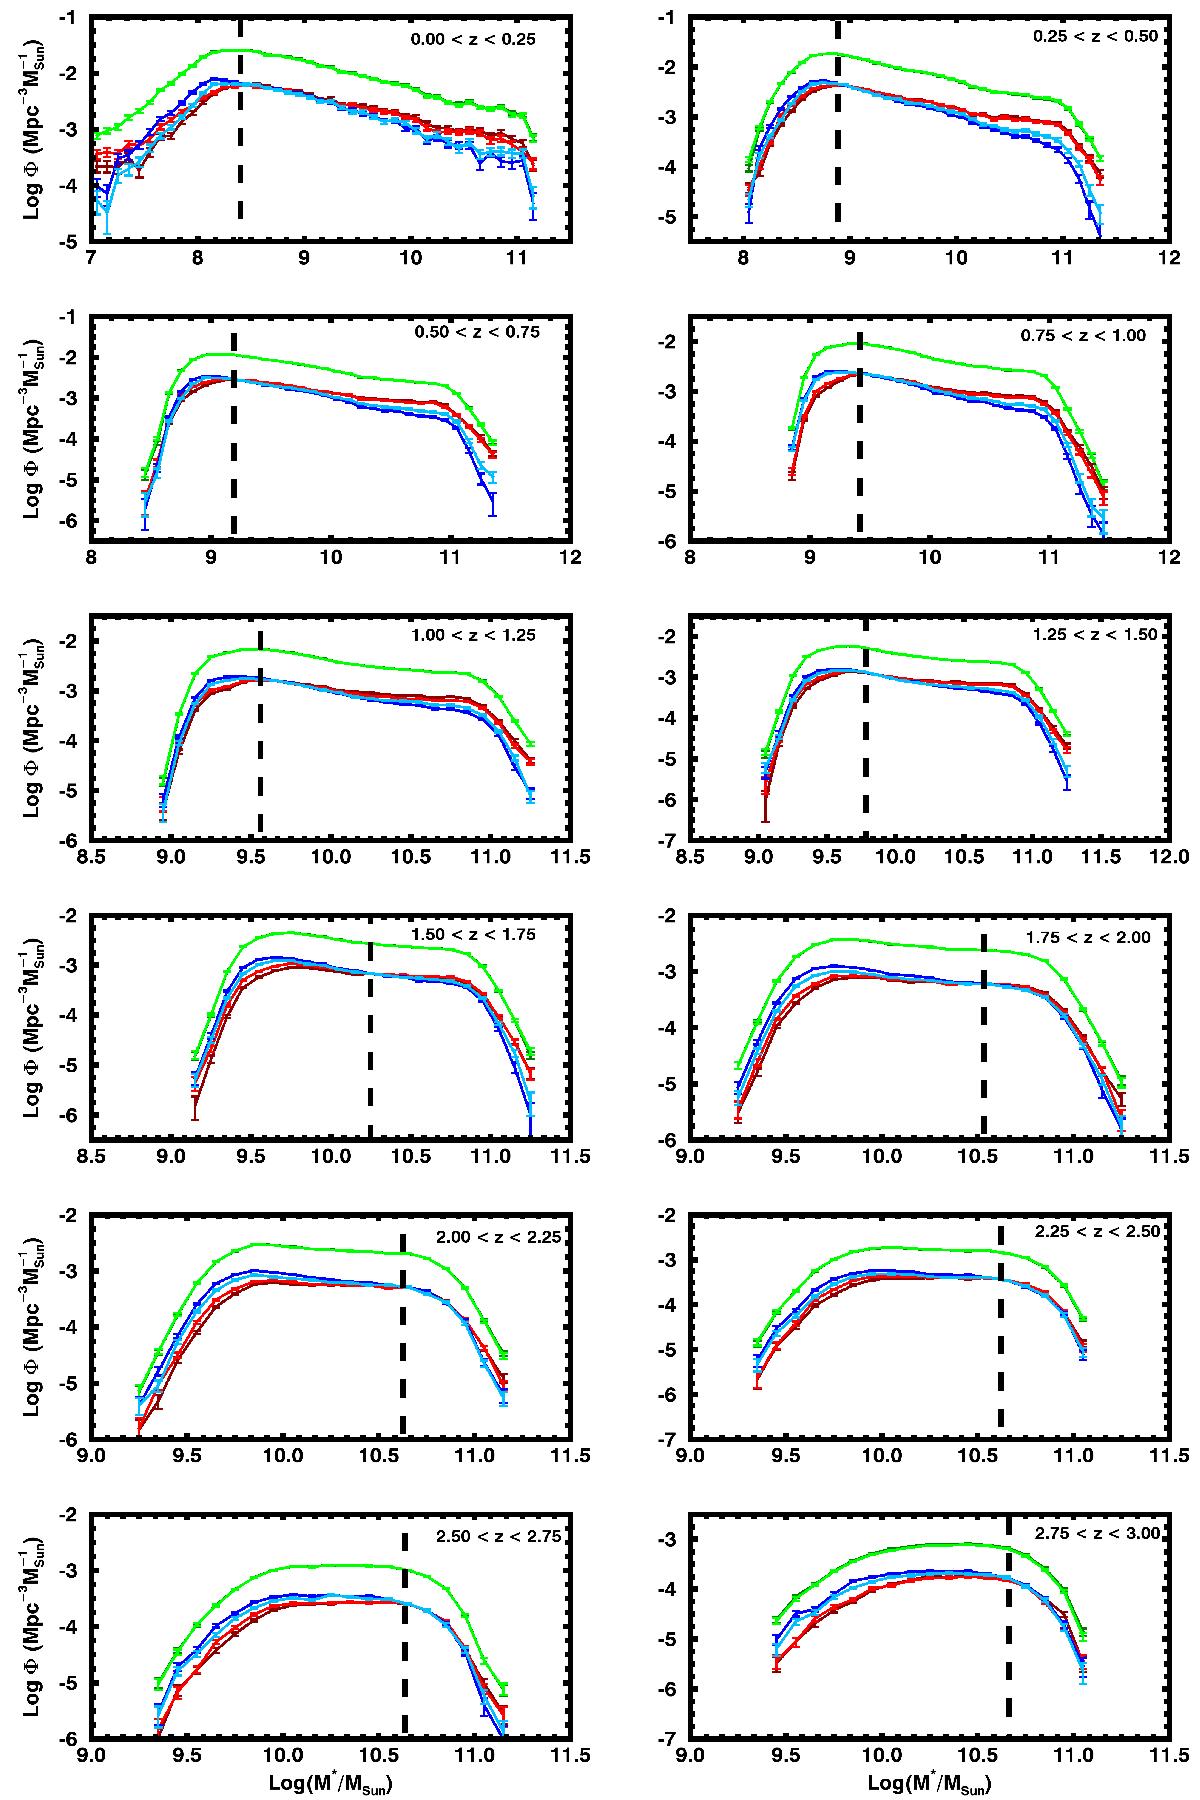
Mock catalogues mass functions – RR = RT = 2 Mpc. The dark green and light green curves refer to the total GSMF, respectively, using ztrue and zphot for the calculation of the mass function. Dark red and light red curves refer to high-density environments, respectively, using ϱtrue, dark red, and using ϱrec, light red. Dark blue and light blue curves refer to low-density environments, respectively, using ϱtrue, dark blue, and using ϱrec, light blue. The black dashed lines are the mass completeness limits described in the text. The parameter values for the aperture are set to RR = RT = 2 Mpc and n = 1.5, with σΔz/ (1 + z) = 0.01. Error bars refer to ![]() estimates.
estimates.
Current usage metrics show cumulative count of Article Views (full-text article views including HTML views, PDF and ePub downloads, according to the available data) and Abstracts Views on Vision4Press platform.
Data correspond to usage on the plateform after 2015. The current usage metrics is available 48-96 hours after online publication and is updated daily on week days.
Initial download of the metrics may take a while.