Fig. 12
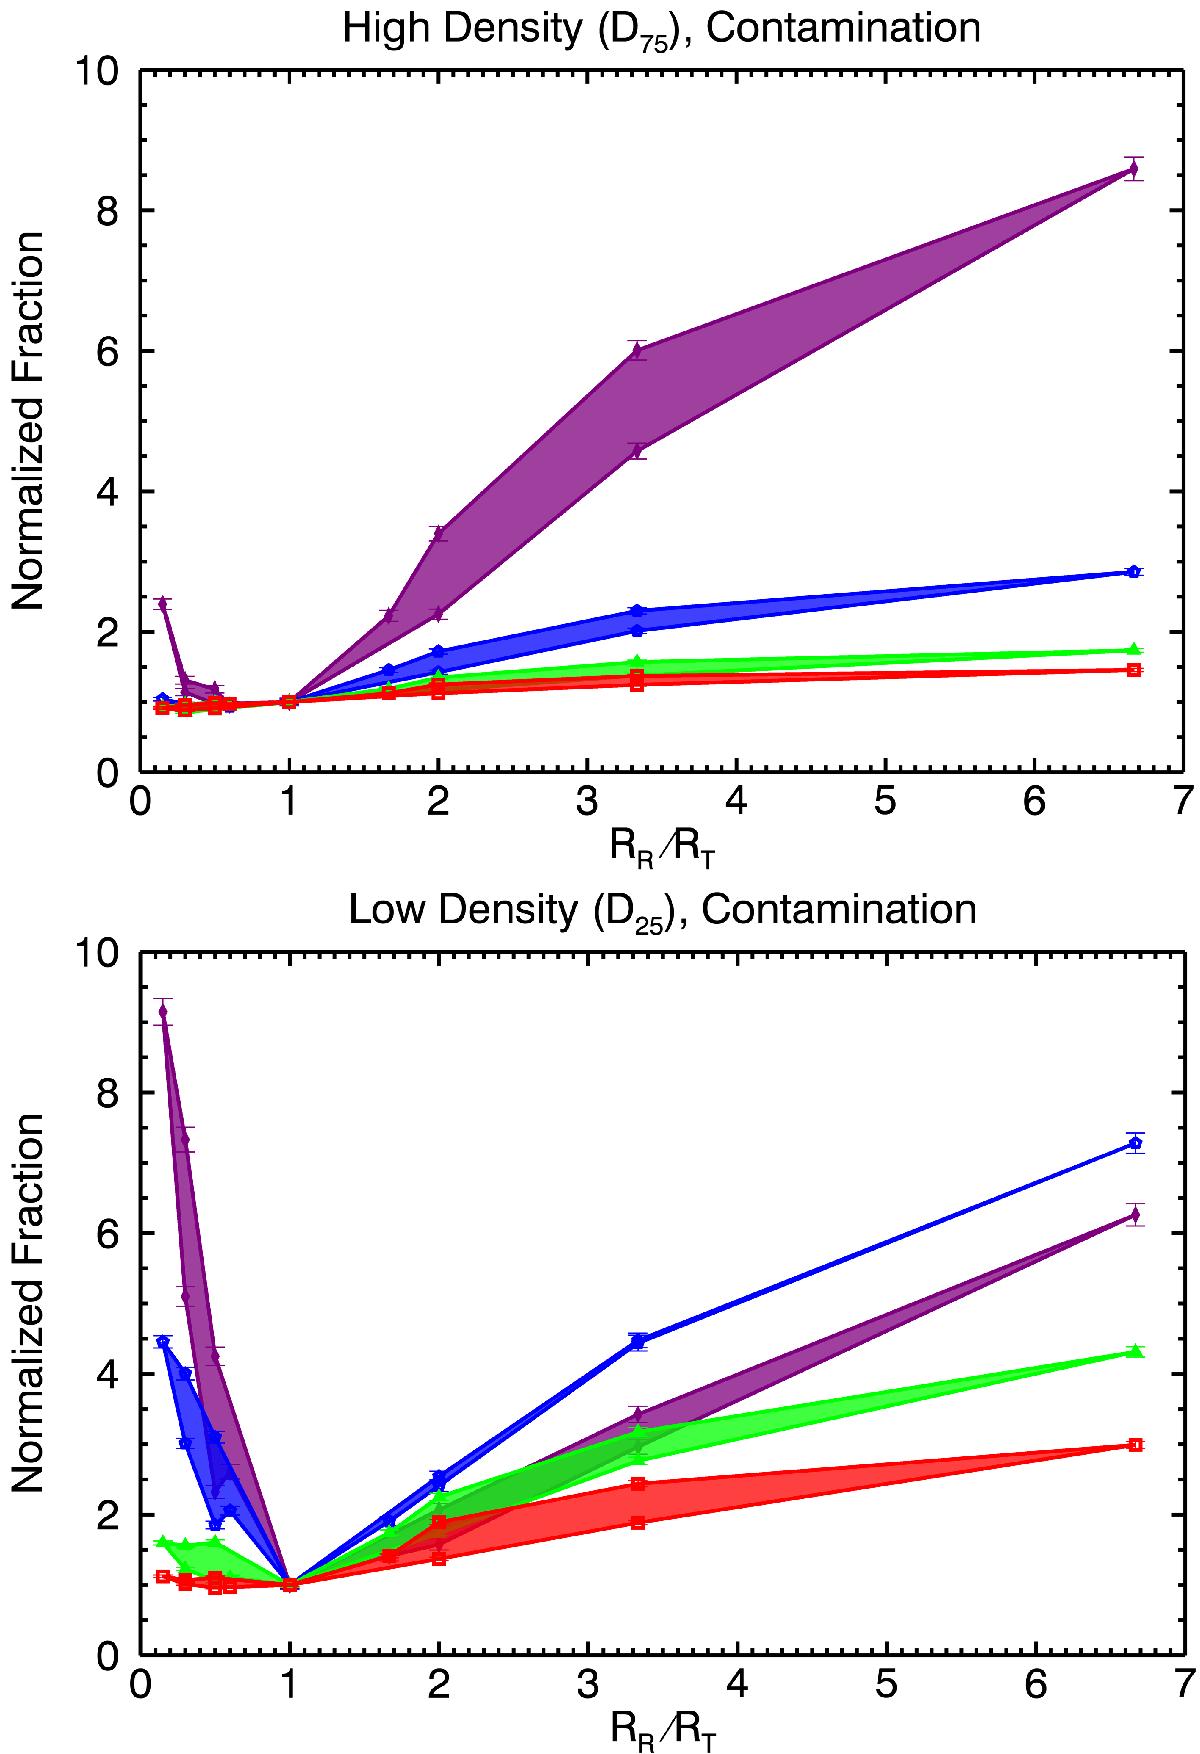
Varying σΔz/ (1 + z) – effect of RR/RT, contamination. fCon (normalized to the value of fCon at RR/RT = 1 separately for each value of σΔz/ (1 + z)) as a function of RR/RT in the redshift bin 1.50 <z< 1.75. Bottom panel refers to low-density environments, while top panel refers to high-density environments. The various curves are colour-coded according to the various values of σΔz/ (1 + z) (purple: σΔz/ (1 + z) = 0.003; blue: σΔz/ (1 + z) = 0.01; green: σΔz/ (1 + z) = 0.03; and red: σΔz/ (1 + z) = 0.06). Shaded regions show the dispersion in the fraction values at fixed RR/RT given by different RT because smaller RT are reconstructed better than larger RT. The length of the volume has been kept fixed, with n = 1.5.
Current usage metrics show cumulative count of Article Views (full-text article views including HTML views, PDF and ePub downloads, according to the available data) and Abstracts Views on Vision4Press platform.
Data correspond to usage on the plateform after 2015. The current usage metrics is available 48-96 hours after online publication and is updated daily on week days.
Initial download of the metrics may take a while.