Fig. 10
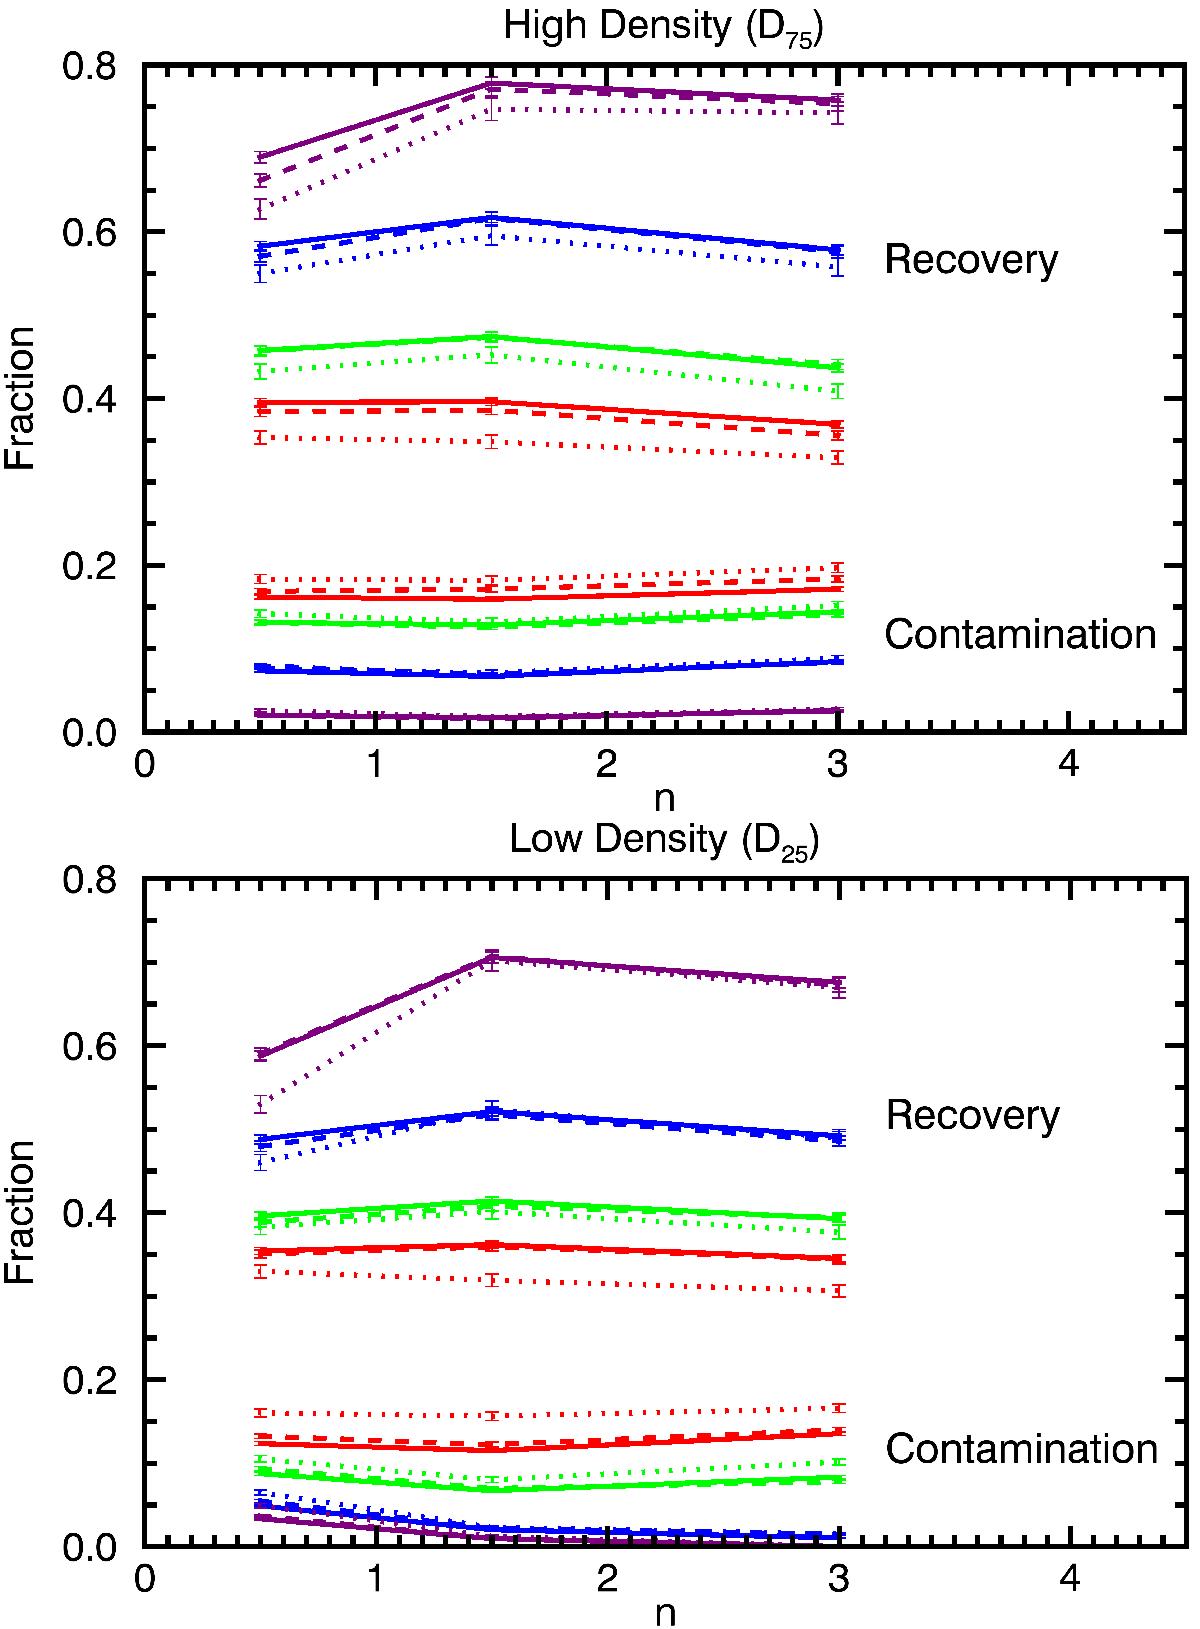
Varying σΔz/ (1 + z) – effect of n. fRec and fCon as a function of the n parameter in three redshift bins, namely 1.50 <z< 1.75 (solid lines), 2.00 <z< 2.25 (dashed lines), and 2.50 <z< 2.75 (dotted lines). Bottom panel refers to low-density environments, while top panel refers to high-density environments. The various curves are colour-coded according to the various values of σΔz/ (1 + z) (purple: σΔz/ (1 + z) = 0.003; blue: σΔz/ (1 + z) = 0.01; green: σΔz/ (1 + z) = 0.03; and red: σΔz/ (1 + z) = 0.06). The aperture radius has been kept fixed to RR = RT = 1 Mpc.
Current usage metrics show cumulative count of Article Views (full-text article views including HTML views, PDF and ePub downloads, according to the available data) and Abstracts Views on Vision4Press platform.
Data correspond to usage on the plateform after 2015. The current usage metrics is available 48-96 hours after online publication and is updated daily on week days.
Initial download of the metrics may take a while.