Fig. A.1
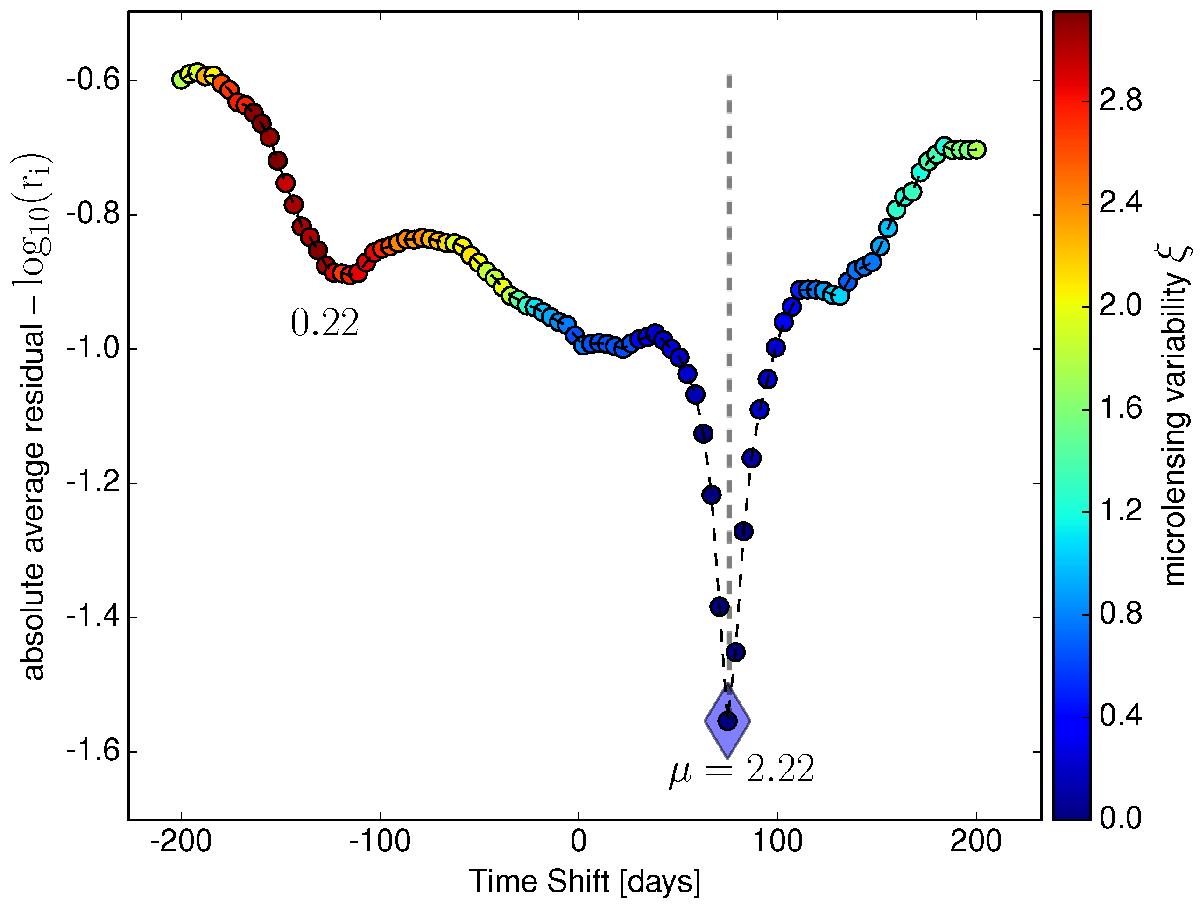
Example of time-delay estimations and confidence level from the automated procedure. The vertical grey dashed line represents the true value of the time delay. The blue diamonds correspond to the smallest absolute average residuals ri returned by the automated procedure. The depth of the two minima μi are represented by the number below each minimum. The colour bar indicates the microlensing variability ξ (see text).
Current usage metrics show cumulative count of Article Views (full-text article views including HTML views, PDF and ePub downloads, according to the available data) and Abstracts Views on Vision4Press platform.
Data correspond to usage on the plateform after 2015. The current usage metrics is available 48-96 hours after online publication and is updated daily on week days.
Initial download of the metrics may take a while.