Fig. 7
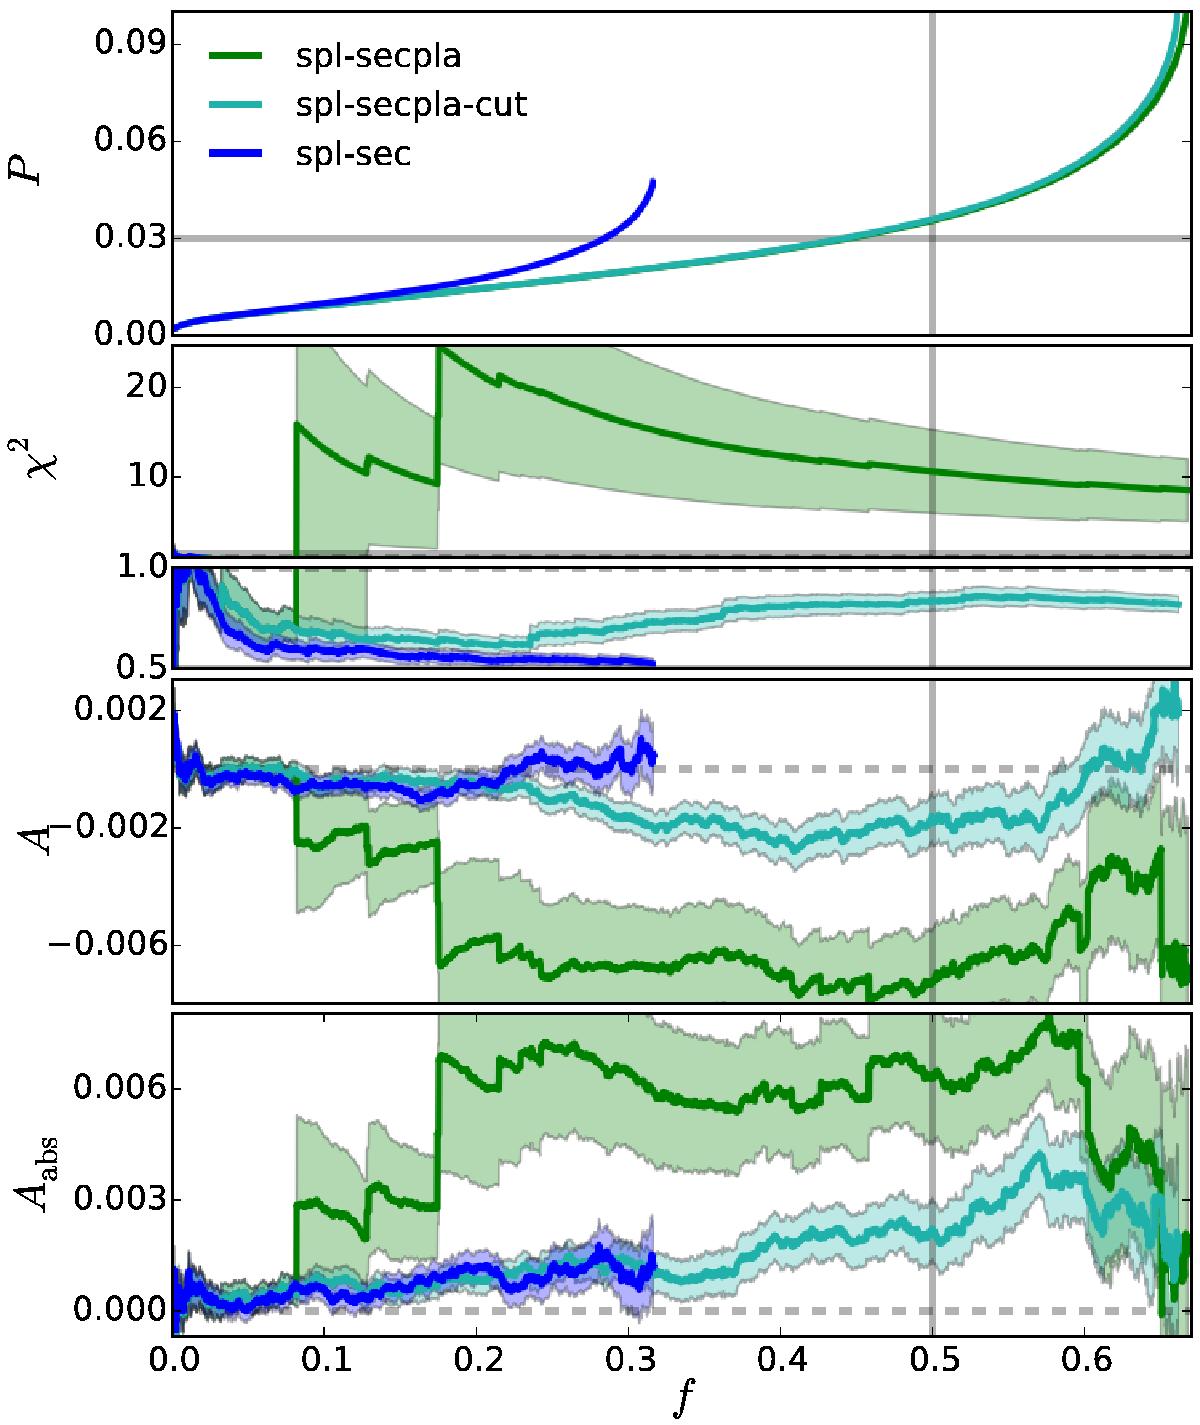
Evolution of the TDC1 metrics with the fraction of estimations sorted by increasing blind precision ![]() , for the spl-sec and spl-secpla samples merging all rungs. The spl-secpla-cut sample has been cleaned a posteriori from the outliers in the spl-secpla sample. In doing so, we removed 29 curves from the spl-secpla sample. The shaded regions, the solid and dashed grey lines are the same as in Fig. 6.
, for the spl-sec and spl-secpla samples merging all rungs. The spl-secpla-cut sample has been cleaned a posteriori from the outliers in the spl-secpla sample. In doing so, we removed 29 curves from the spl-secpla sample. The shaded regions, the solid and dashed grey lines are the same as in Fig. 6.
Current usage metrics show cumulative count of Article Views (full-text article views including HTML views, PDF and ePub downloads, according to the available data) and Abstracts Views on Vision4Press platform.
Data correspond to usage on the plateform after 2015. The current usage metrics is available 48-96 hours after online publication and is updated daily on week days.
Initial download of the metrics may take a while.