Fig. 6
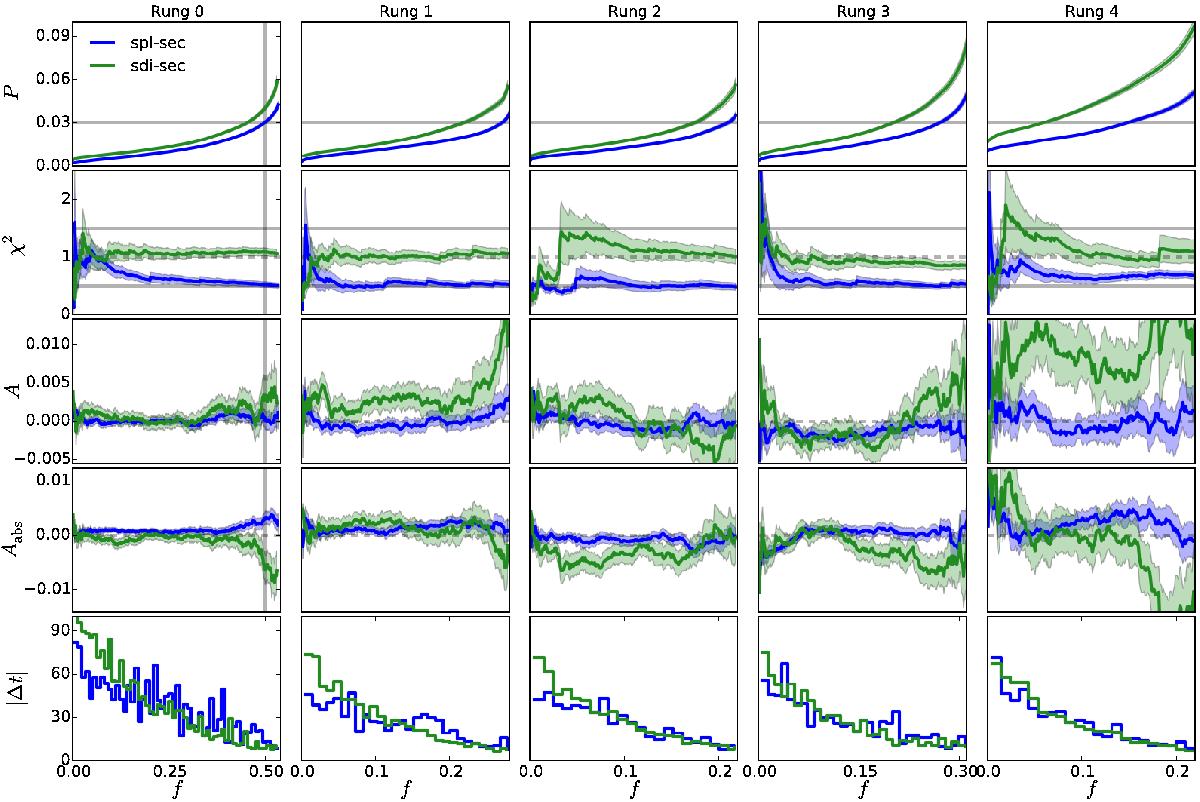
Evolution of the TDC1 metrics per rung as a function of the fraction of estimations f for the spl-sec and sdi-sec samples. The plots are sorted by increasing values of the blind precision ![]() (see text). Shaded regions represent the error on the metrics. Solid grey lines show the target values for the metrics as defined in the TDC1 paper. Dashed grey lines show the best possible value for each metric. The bottom row presents the non-cumulative evolution of the median of the true time delays | Δti | in bins of ten estimations.
(see text). Shaded regions represent the error on the metrics. Solid grey lines show the target values for the metrics as defined in the TDC1 paper. Dashed grey lines show the best possible value for each metric. The bottom row presents the non-cumulative evolution of the median of the true time delays | Δti | in bins of ten estimations.
Current usage metrics show cumulative count of Article Views (full-text article views including HTML views, PDF and ePub downloads, according to the available data) and Abstracts Views on Vision4Press platform.
Data correspond to usage on the plateform after 2015. The current usage metrics is available 48-96 hours after online publication and is updated daily on week days.
Initial download of the metrics may take a while.