Fig. 5
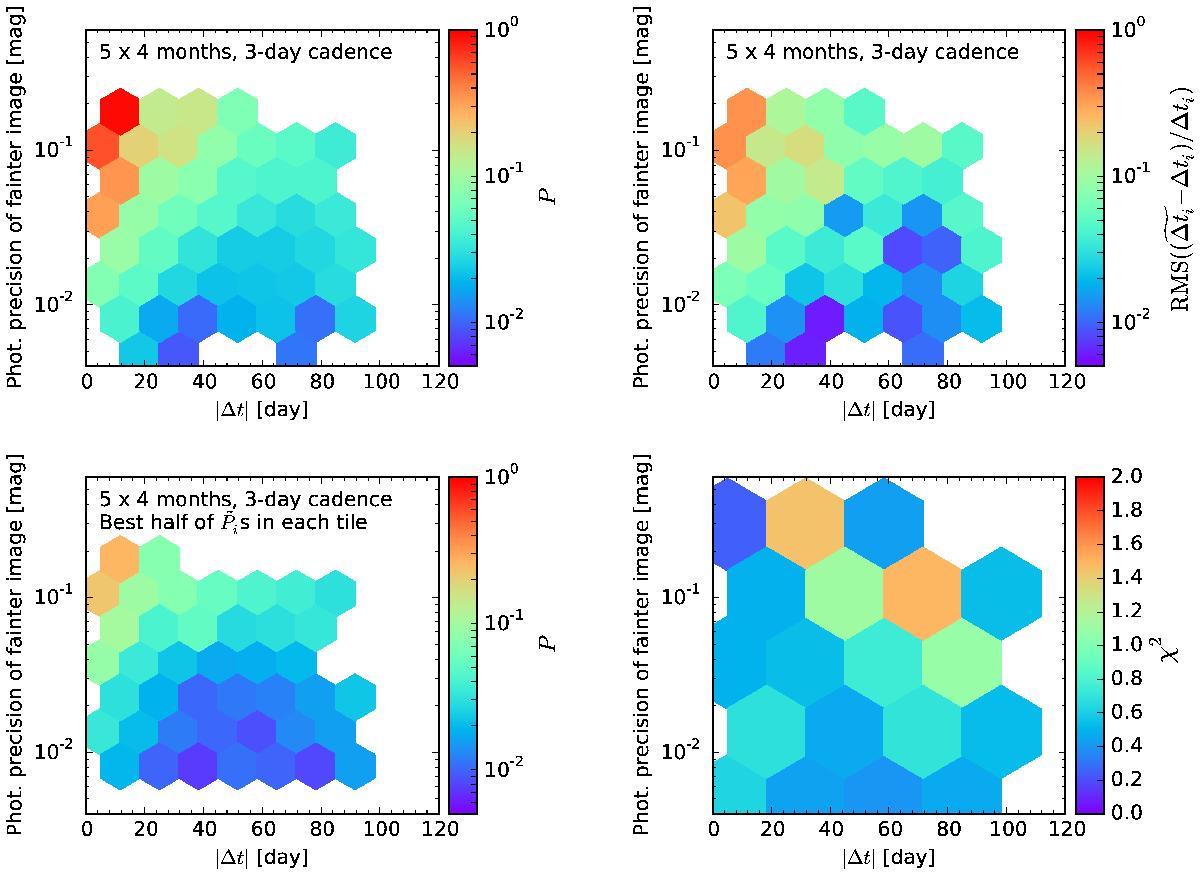
Quantitative analysis of the precision achieved for the Stage II time-delay measurement as a function of the photometric precision of the fainter quasar image and as a function of the true time delay. All panels show results from the bias-free spl technique for the secure + plausible selection of rungs 2 and 3 after rejection of the catastrophic outliers (see text). Top left panel shows the metric P as computed using the uncertainty estimates δi without using ![]() . Top right panel shows the rms of the relative point estimation residuals without considering δi. Bottom left panel shows the average P obtained in each tile after selecting only the best half of systems according to the blind precision in
. Top right panel shows the rms of the relative point estimation residuals without considering δi. Bottom left panel shows the average P obtained in each tile after selecting only the best half of systems according to the blind precision in ![]() . Bottom right panel shows a map of the χ2 metric. In all panels, only tiles describing more than three light curve pairs are shown.
. Bottom right panel shows a map of the χ2 metric. In all panels, only tiles describing more than three light curve pairs are shown.
Current usage metrics show cumulative count of Article Views (full-text article views including HTML views, PDF and ePub downloads, according to the available data) and Abstracts Views on Vision4Press platform.
Data correspond to usage on the plateform after 2015. The current usage metrics is available 48-96 hours after online publication and is updated daily on week days.
Initial download of the metrics may take a while.