Free Access
Fig. 4
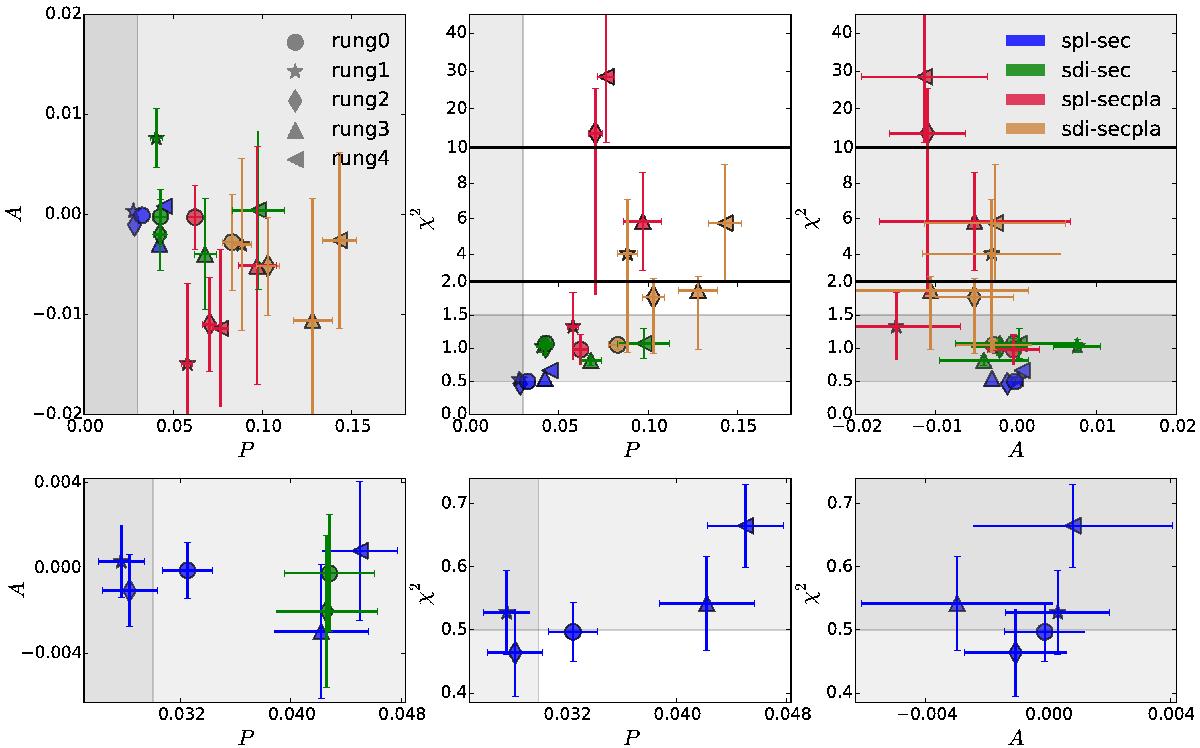
Summary of metrics obtained with the Stage II algorithms spl and sdi, without any a posteriori clipping of the outliers. Bottom row presents enlargements taken from the panels on the upper row. The shaded regions represent the somewhat arbitrary target areas that were defined in the TDC1 paper.
Current usage metrics show cumulative count of Article Views (full-text article views including HTML views, PDF and ePub downloads, according to the available data) and Abstracts Views on Vision4Press platform.
Data correspond to usage on the plateform after 2015. The current usage metrics is available 48-96 hours after online publication and is updated daily on week days.
Initial download of the metrics may take a while.