Fig. 3
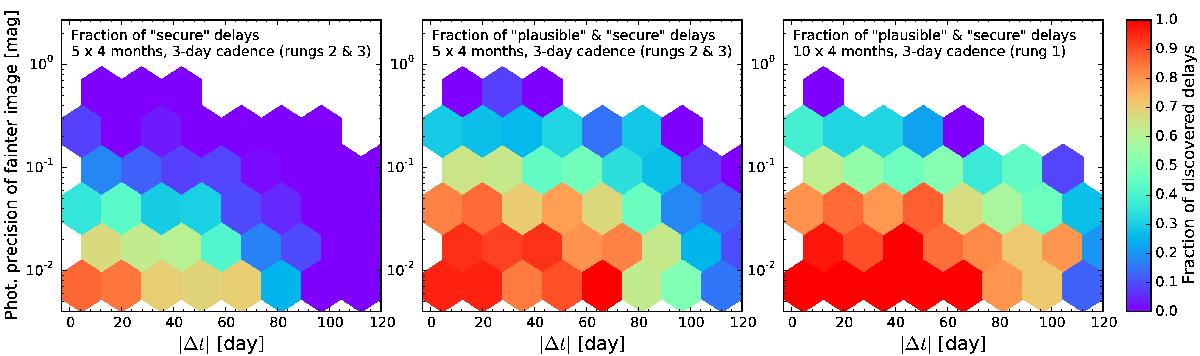
Quantitative analysis of the discoverability of time delays through the extensive visual search with D3CS (Stage I) in the case of four-month observing seasons and a cadence of 3 days. The coloured tiles show the fraction of discovered delays as a function of the photometric precision of the fainter quasar image and the true time delay of the system. Left panel shows results from the very conservative sec sample, and central panel shows the less pure secpla sample that includes delay candidates considered as plausible (see text). Right panel, also for secpla, doubles the number of observing seasons. In each panel, only tiles covering more than three light curve pairs are shown.
Current usage metrics show cumulative count of Article Views (full-text article views including HTML views, PDF and ePub downloads, according to the available data) and Abstracts Views on Vision4Press platform.
Data correspond to usage on the plateform after 2015. The current usage metrics is available 48-96 hours after online publication and is updated daily on week days.
Initial download of the metrics may take a while.