Fig. 2
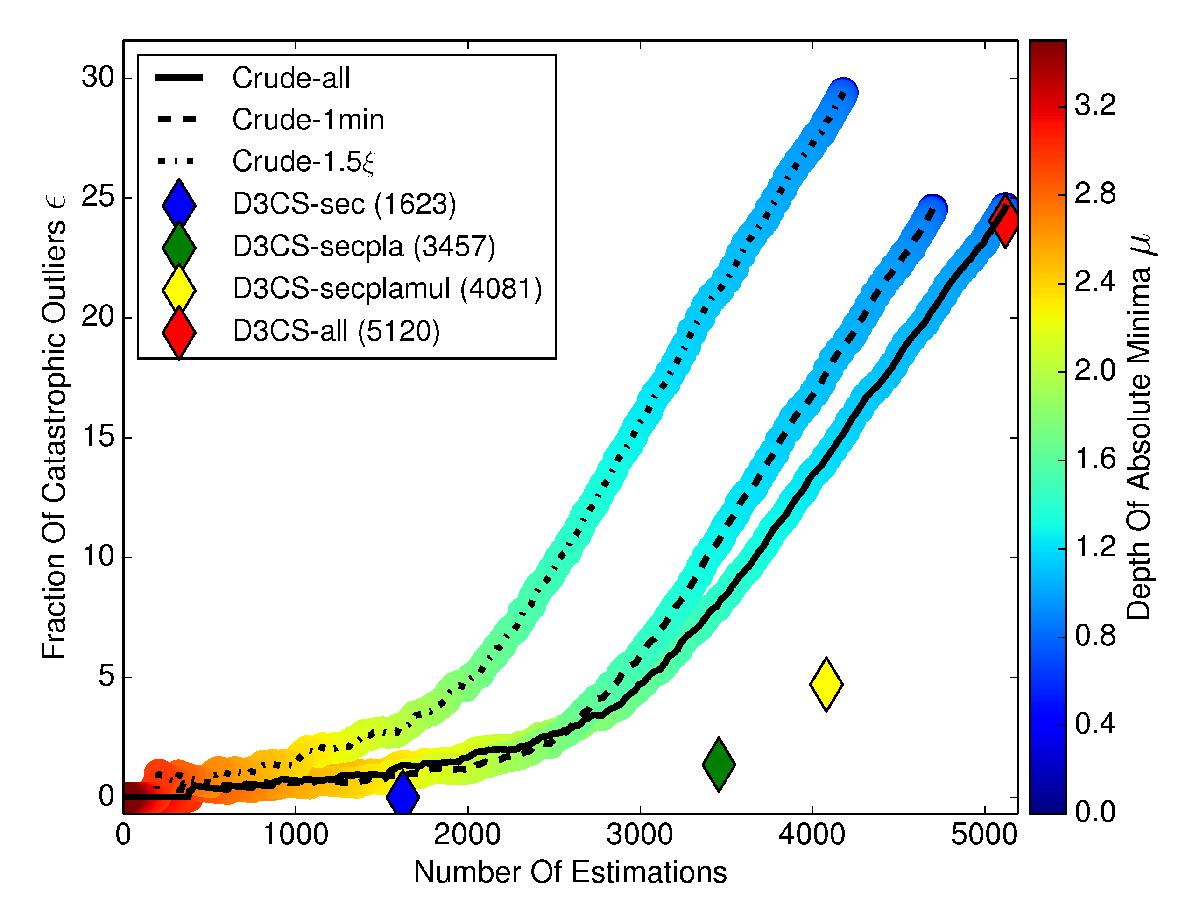
Cumulative evolution of the fraction of catastrophic outliers ϵ (in percentage points) as a function of the number of time-delay estimations. To produce the plot, the curves are first sorted according to the depth of their absolute minimum μ, indicated in the colour bar. Each black line (solid, dashed and dotted) represents a different subsample (see text for details). The coloured diamonds show the value of ϵ for the D3CS combined samples; the corresponding number of estimations are indicated in parenthesis.
Current usage metrics show cumulative count of Article Views (full-text article views including HTML views, PDF and ePub downloads, according to the available data) and Abstracts Views on Vision4Press platform.
Data correspond to usage on the plateform after 2015. The current usage metrics is available 48-96 hours after online publication and is updated daily on week days.
Initial download of the metrics may take a while.