Fig. 9
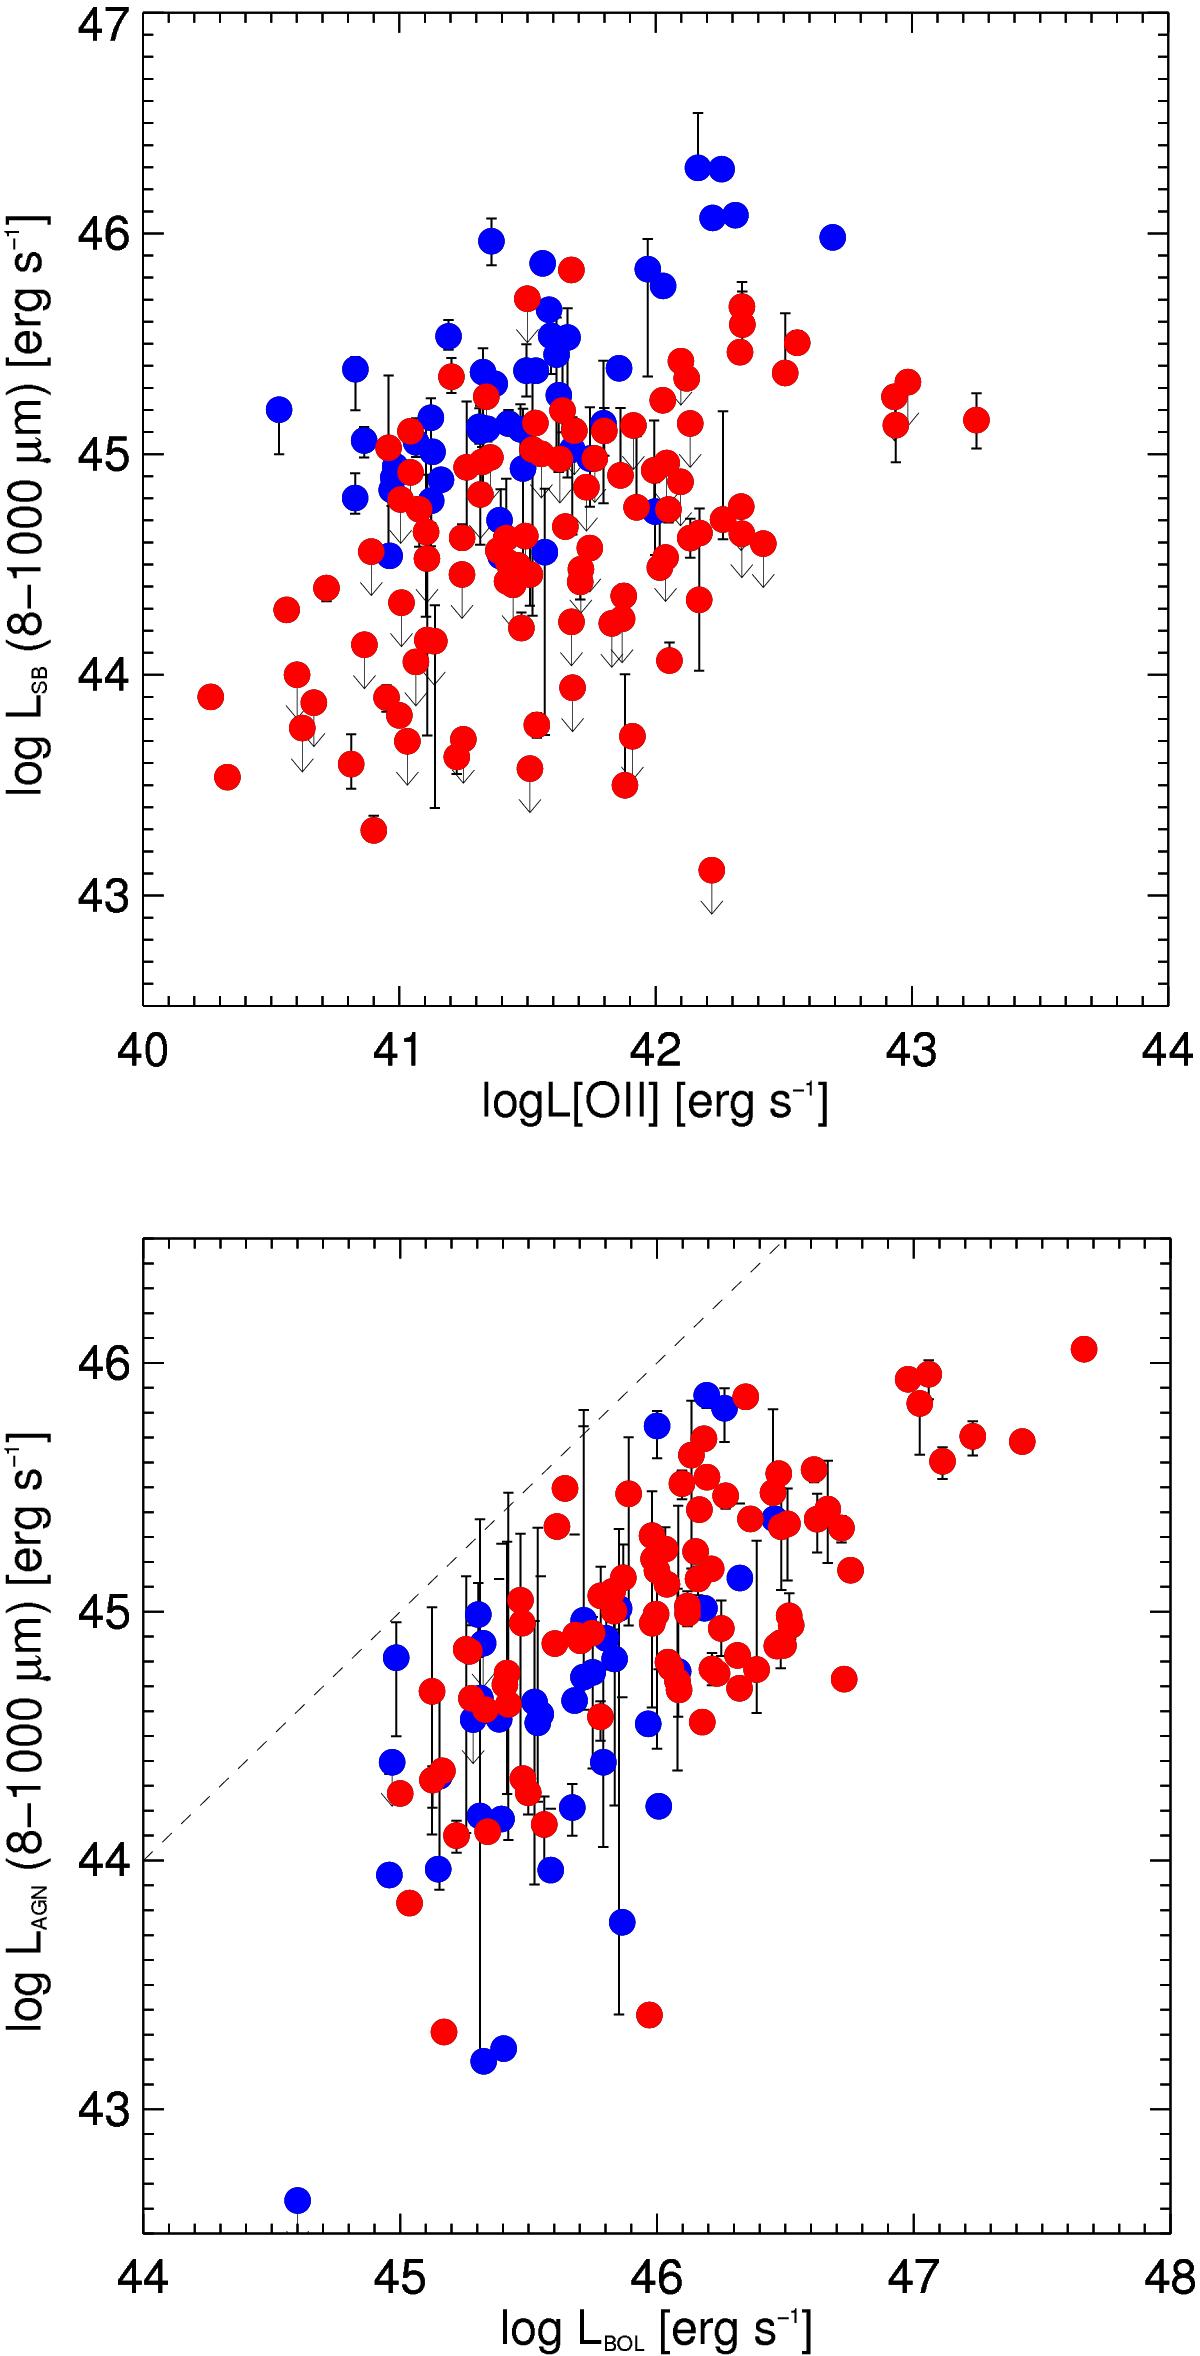
Upper panel: logarithm of the infrared luminosity in the 8–1000 μm range for the starburst component derived from the SED fitting versus the logarithm of the [OII] luminosity, another estimator for the SFR. Bottom panel: logarithm of the infrared luminosity in the 8–1000 μm range for the hot dust component derived from the SED model (likely produced by a dusty torus warm up by the AGN) versus the logarithm of the AGN bolometric luminosity. Blue and red points represent quasars dominated in the infrared by star formation or by the AGN emission, respectively.
Current usage metrics show cumulative count of Article Views (full-text article views including HTML views, PDF and ePub downloads, according to the available data) and Abstracts Views on Vision4Press platform.
Data correspond to usage on the plateform after 2015. The current usage metrics is available 48-96 hours after online publication and is updated daily on week days.
Initial download of the metrics may take a while.