Fig. 8
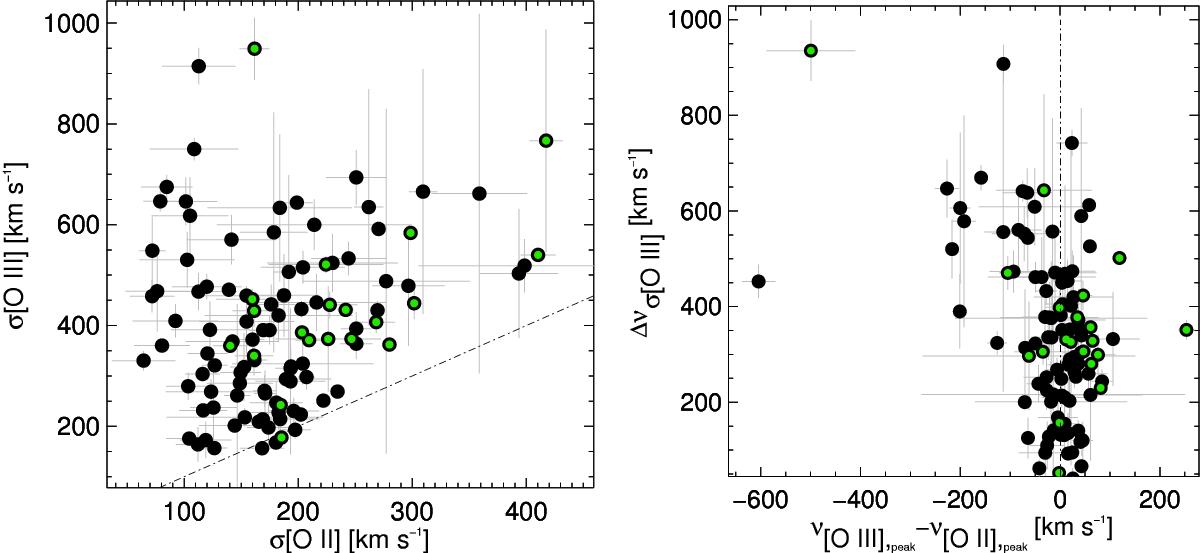
Comparison of the [OIII] and [OII] principal emission line parameters. Left panel: sigma of the [O III] line versus the sigma of the [O II]. The [OIII] lines show broader widths. Right panel: σ excess (defined using the square root of the quadratic difference of the [O III] and [O II] sigma, see text) versus the relative shift of the [O III] peak respect to [O II] peak (both referring to their rest frame position).
Current usage metrics show cumulative count of Article Views (full-text article views including HTML views, PDF and ePub downloads, according to the available data) and Abstracts Views on Vision4Press platform.
Data correspond to usage on the plateform after 2015. The current usage metrics is available 48-96 hours after online publication and is updated daily on week days.
Initial download of the metrics may take a while.