Fig. 7
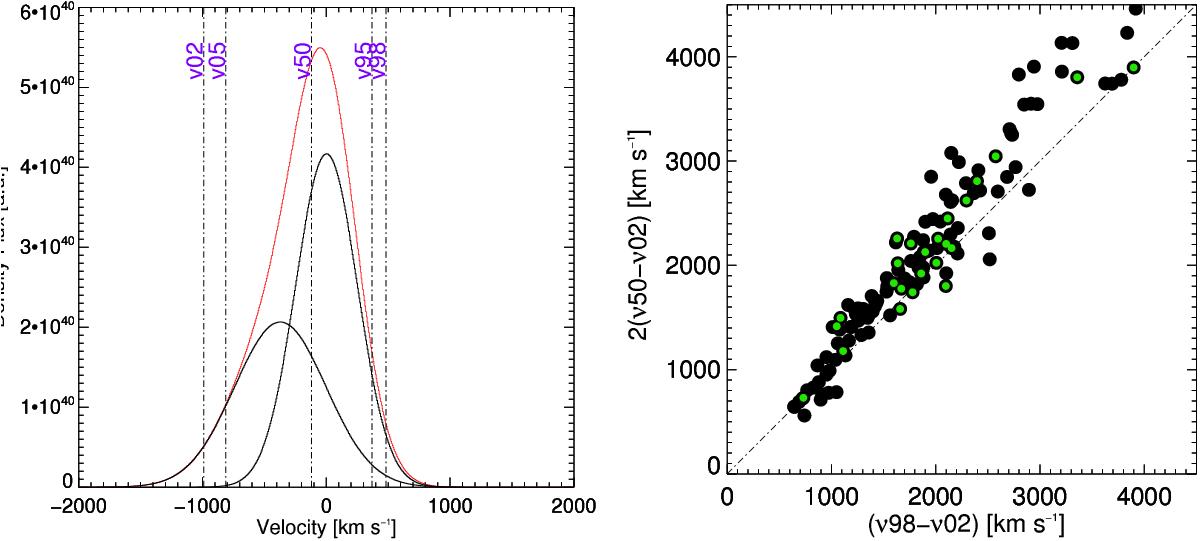
Left panel: example of [OIII]λ5007 line decomposition in a narrow and broad component and of different velocity definition used to characterize the properties of the outflow. In particular we show velocities at different percentiles of the flux contained in the overall emission line profile (from left to right: 2nd; 5th, 50th, 95th, and 98th). Right panel: two times the blue tail, defined as (v50-v02) versus maximum velocity of the [O III] line (v98-v02). The dashed line is the bisectrix of the plane and represents the condition for symmetry. Almost all of the objects show a broad blue tail. Green points are for radio loud quasars.
Current usage metrics show cumulative count of Article Views (full-text article views including HTML views, PDF and ePub downloads, according to the available data) and Abstracts Views on Vision4Press platform.
Data correspond to usage on the plateform after 2015. The current usage metrics is available 48-96 hours after online publication and is updated daily on week days.
Initial download of the metrics may take a while.