Fig. 5
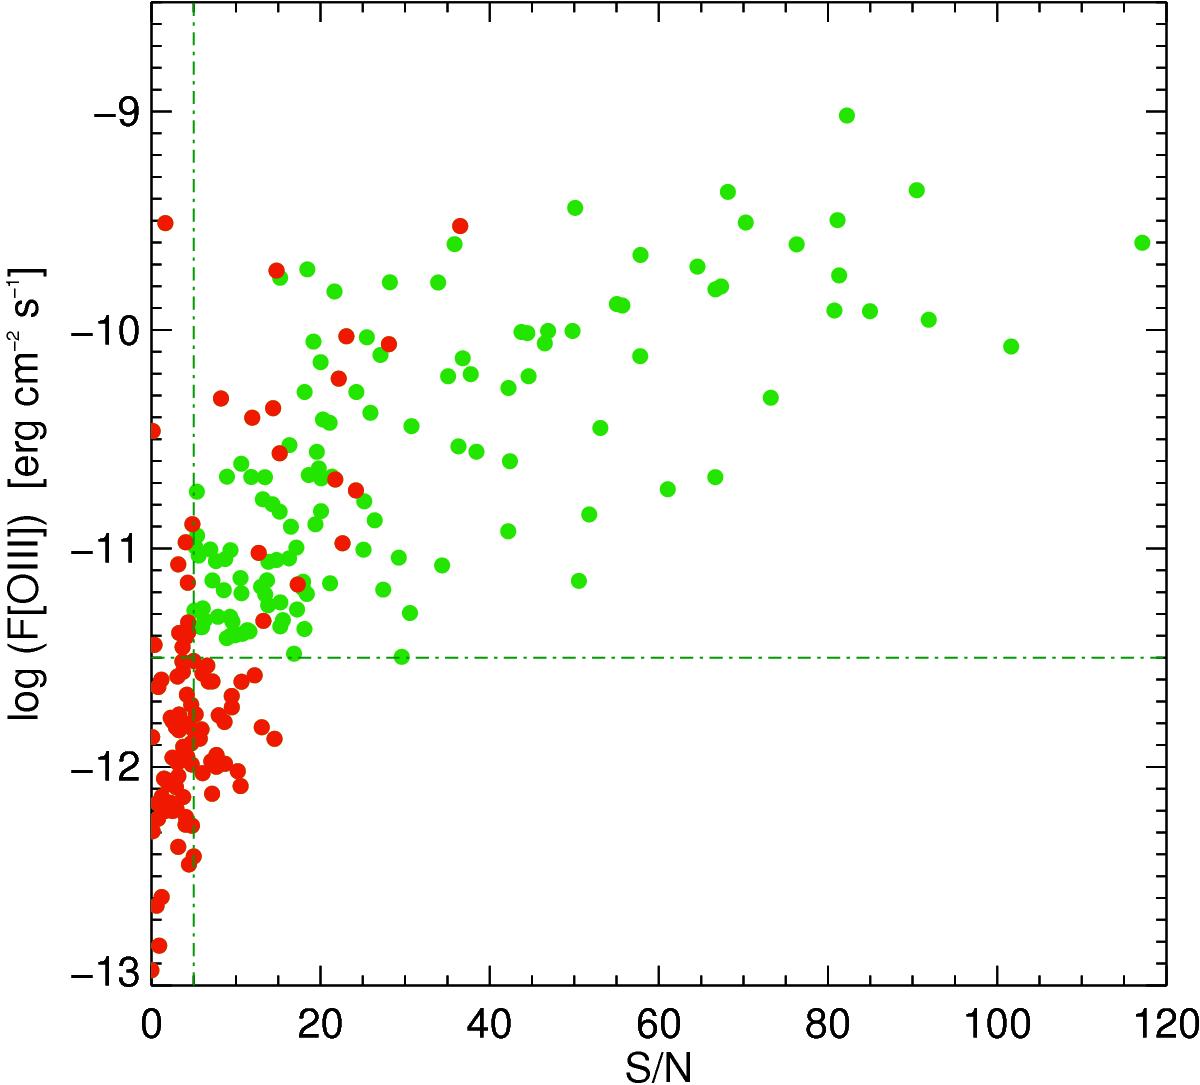
Logarithmic flux (in erg s-1 cm-2) versus the signal-to-noise ratio of the [O III] emission line. We adopt the dotted line as the threshold in flux and S/N to select only spectra with a visible [O III] emission line and reliable fit (green points). Red points represent the quasars for which we consider the kinematic parameters based on unreliable [O III] lines and we do not consider these QSO in the following analysis.
Current usage metrics show cumulative count of Article Views (full-text article views including HTML views, PDF and ePub downloads, according to the available data) and Abstracts Views on Vision4Press platform.
Data correspond to usage on the plateform after 2015. The current usage metrics is available 48-96 hours after online publication and is updated daily on week days.
Initial download of the metrics may take a while.