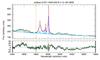
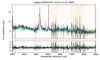
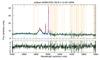
Fig. 4
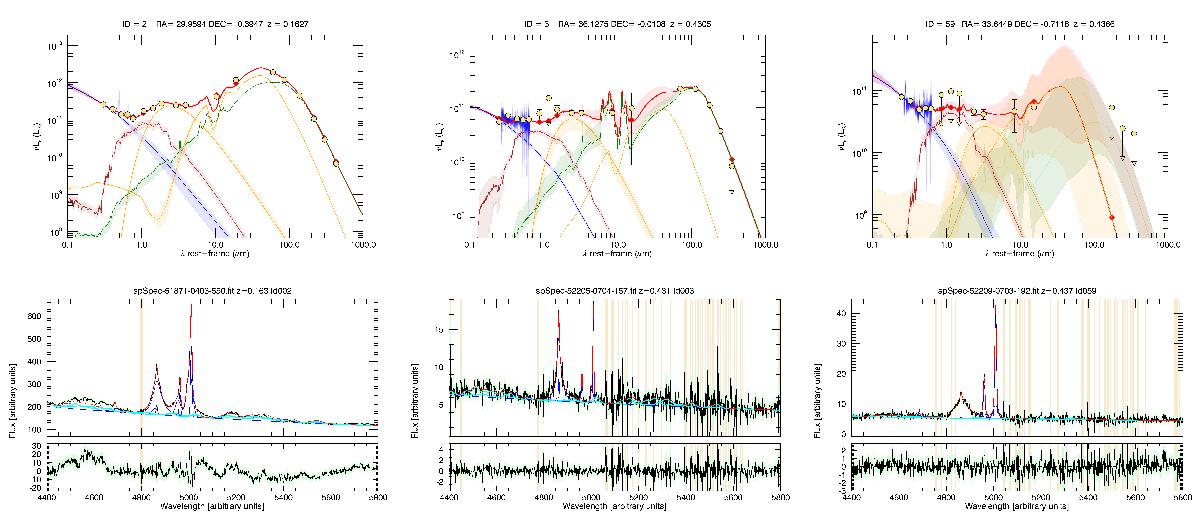
Top panel: example of SED fitting for three quasars SDSS J015950.24+002340.8, SDSS J022430.60-000038.9, and SDSS J021434.78-004242.6 of different SED and spectra quality. Points in yellow represent the luminosity of quasars (in solar luminosity units) from SDSS, 2MASS, WISE, PACS, and SPIRE images plotted versus the rest-frame wavelength (from 0.1 to 1000 μm ). We plot in green the starburst template, in orange the torus and the hot black-body model, in brown the old star, and in blue the accretion disk component. The results of the composition is the best fit, shown in red. The hatched area represents the uncertainties for the normalization of each model components obtained from the Monte Carlo analysis. Bottom panel: example of the fit of the SDSS optical spectra for the same quasars presented above. In blue we plot the different components of the emission lines (narrow and broad) and in cyan the Fe emission lines template. In the bottom panel we show the residuals of the fit.
Current usage metrics show cumulative count of Article Views (full-text article views including HTML views, PDF and ePub downloads, according to the available data) and Abstracts Views on Vision4Press platform.
Data correspond to usage on the plateform after 2015. The current usage metrics is available 48-96 hours after online publication and is updated daily on week days.
Initial download of the metrics may take a while.