Fig. 3
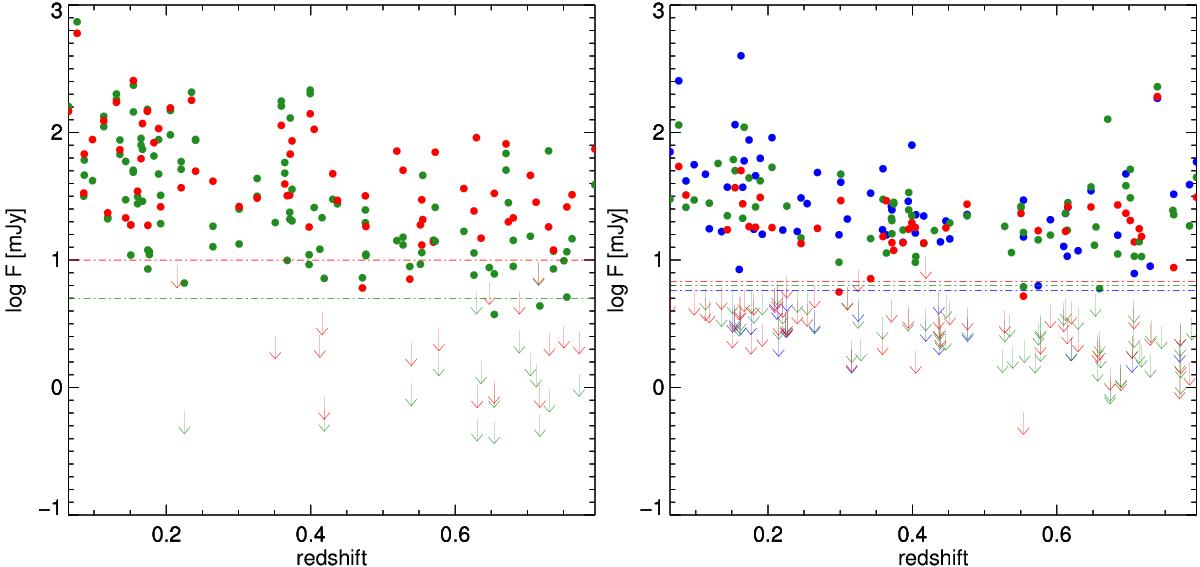
Left panel: observed source fluxes in the PACS bands at 70/100 μm and 160 μm (green and red points, respectively), compared with the detector sensitivity threshold at 5σ for one hour of observation (shown as dash-dotted green and red lines). Right panel: same figure for the SPIRE band at 250 μm, 350 μm, 500 μm (blue, green, and red points, respectively). The three dash-dotted lines are the detector sensitivity thresholds in the three bands at 5σ for one-hour observations.
Current usage metrics show cumulative count of Article Views (full-text article views including HTML views, PDF and ePub downloads, according to the available data) and Abstracts Views on Vision4Press platform.
Data correspond to usage on the plateform after 2015. The current usage metrics is available 48-96 hours after online publication and is updated daily on week days.
Initial download of the metrics may take a while.