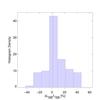
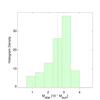
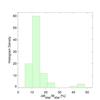
Fig. A.1
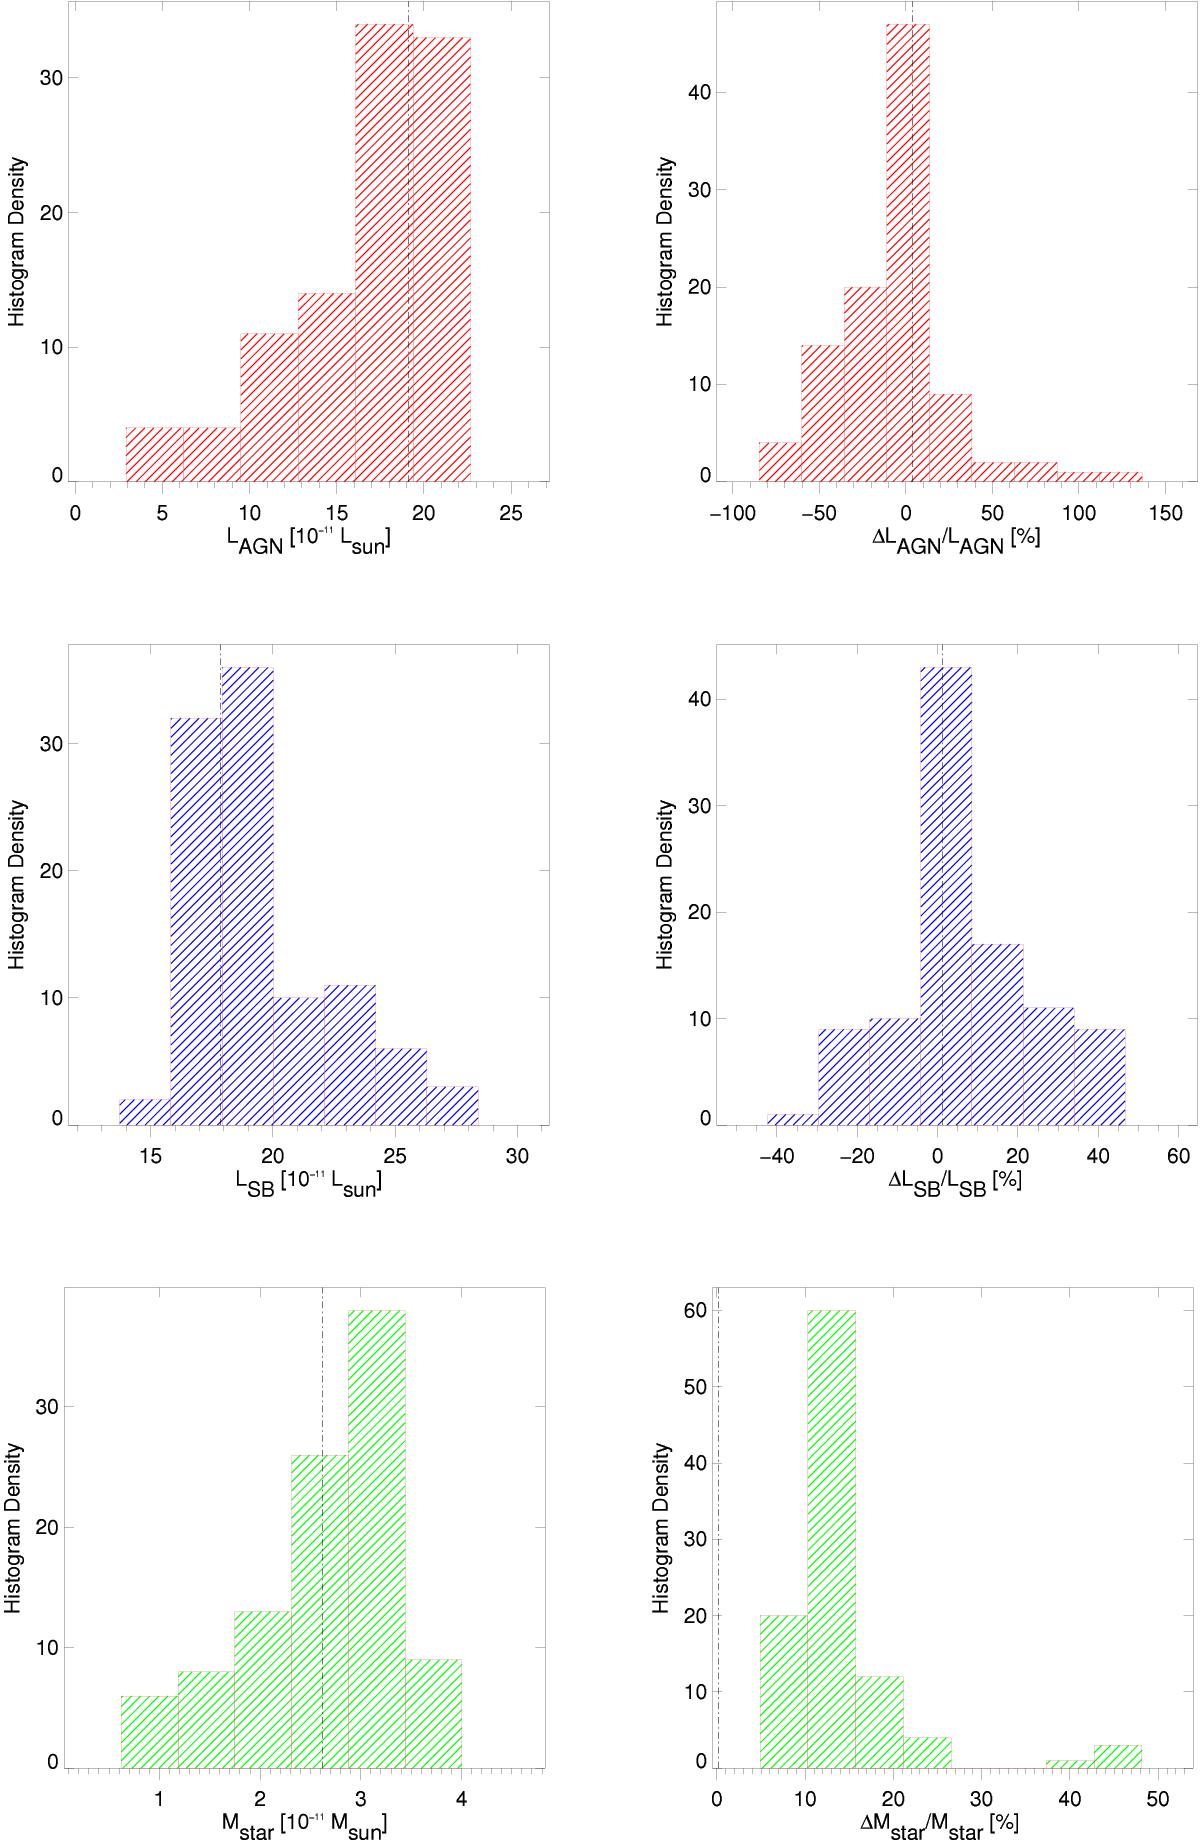
Example of a SED fitting test. Left panel: distribution of the AGN luminosity, SB luminosity, and stellar mass obtained in 100 iterations obtained from theoretical SEDs, and by varying the photometric points according to the observed uncertainties compared to the theoretical value represented by the dashed line. Right panel: as before, but we plot the distribution in percentage of the relative errors for the parameters in each iteration.
Current usage metrics show cumulative count of Article Views (full-text article views including HTML views, PDF and ePub downloads, according to the available data) and Abstracts Views on Vision4Press platform.
Data correspond to usage on the plateform after 2015. The current usage metrics is available 48-96 hours after online publication and is updated daily on week days.
Initial download of the metrics may take a while.