Fig. 14
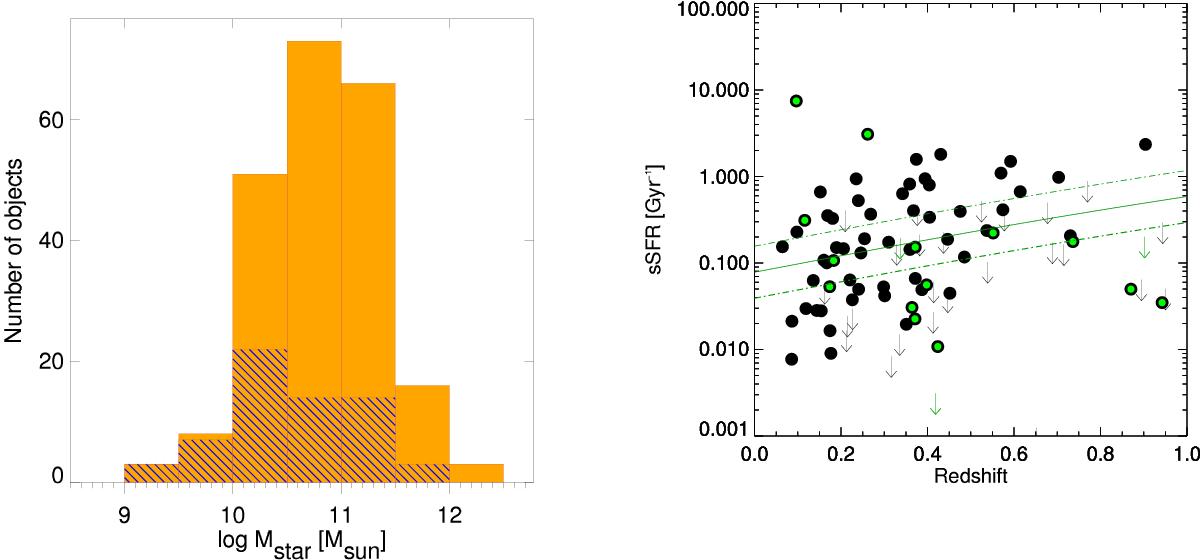
Left panel: histogram of the logarithm of the stellar masses in M⊙ derived for our sample of type 1 quasars. The hatched area represents uncertain values. Right panel: evolution of the main sequence SFR with redshift. The solid line represents the relation between sSFR and redshift and the two dashed lines are a factor of two above and below this line.
Current usage metrics show cumulative count of Article Views (full-text article views including HTML views, PDF and ePub downloads, according to the available data) and Abstracts Views on Vision4Press platform.
Data correspond to usage on the plateform after 2015. The current usage metrics is available 48-96 hours after online publication and is updated daily on week days.
Initial download of the metrics may take a while.