Fig. 13
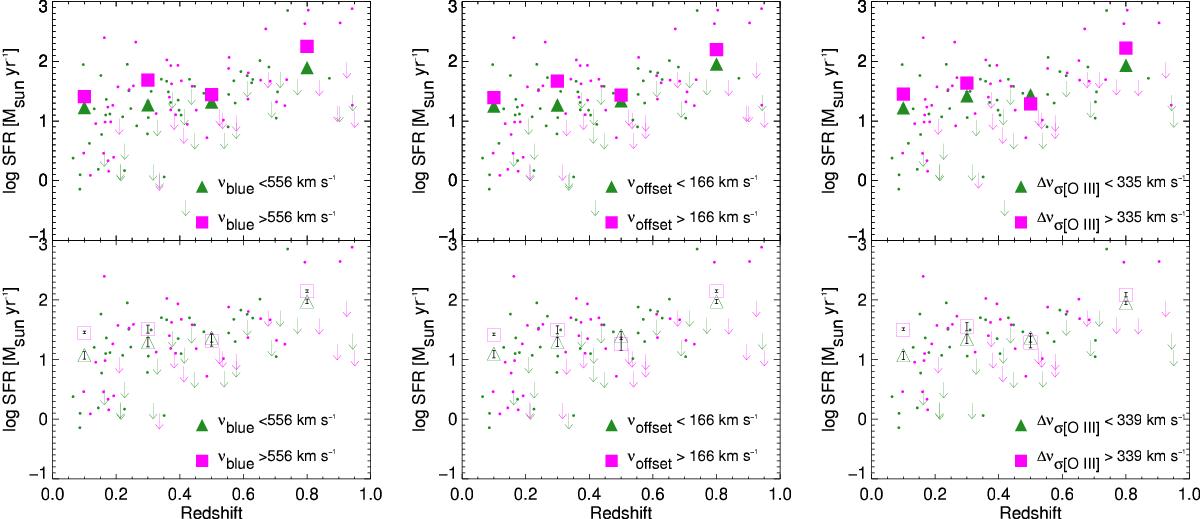
Upper panel: star formation rate plotted in four bins of redshift for the complete sample of quasars. We adopt different criteria for separating strong-outflow (small magenta points) and weak-outflow galaxies (small green points), respectively higher and lower than the median value of the distribution of the three parameters (νblue (first panel), Δνoffset (second panel), and Δνσ [O III] ). Bottom panel: same as top, but excluding radio loud quasars.
Current usage metrics show cumulative count of Article Views (full-text article views including HTML views, PDF and ePub downloads, according to the available data) and Abstracts Views on Vision4Press platform.
Data correspond to usage on the plateform after 2015. The current usage metrics is available 48-96 hours after online publication and is updated daily on week days.
Initial download of the metrics may take a while.