Free Access
Fig. 1
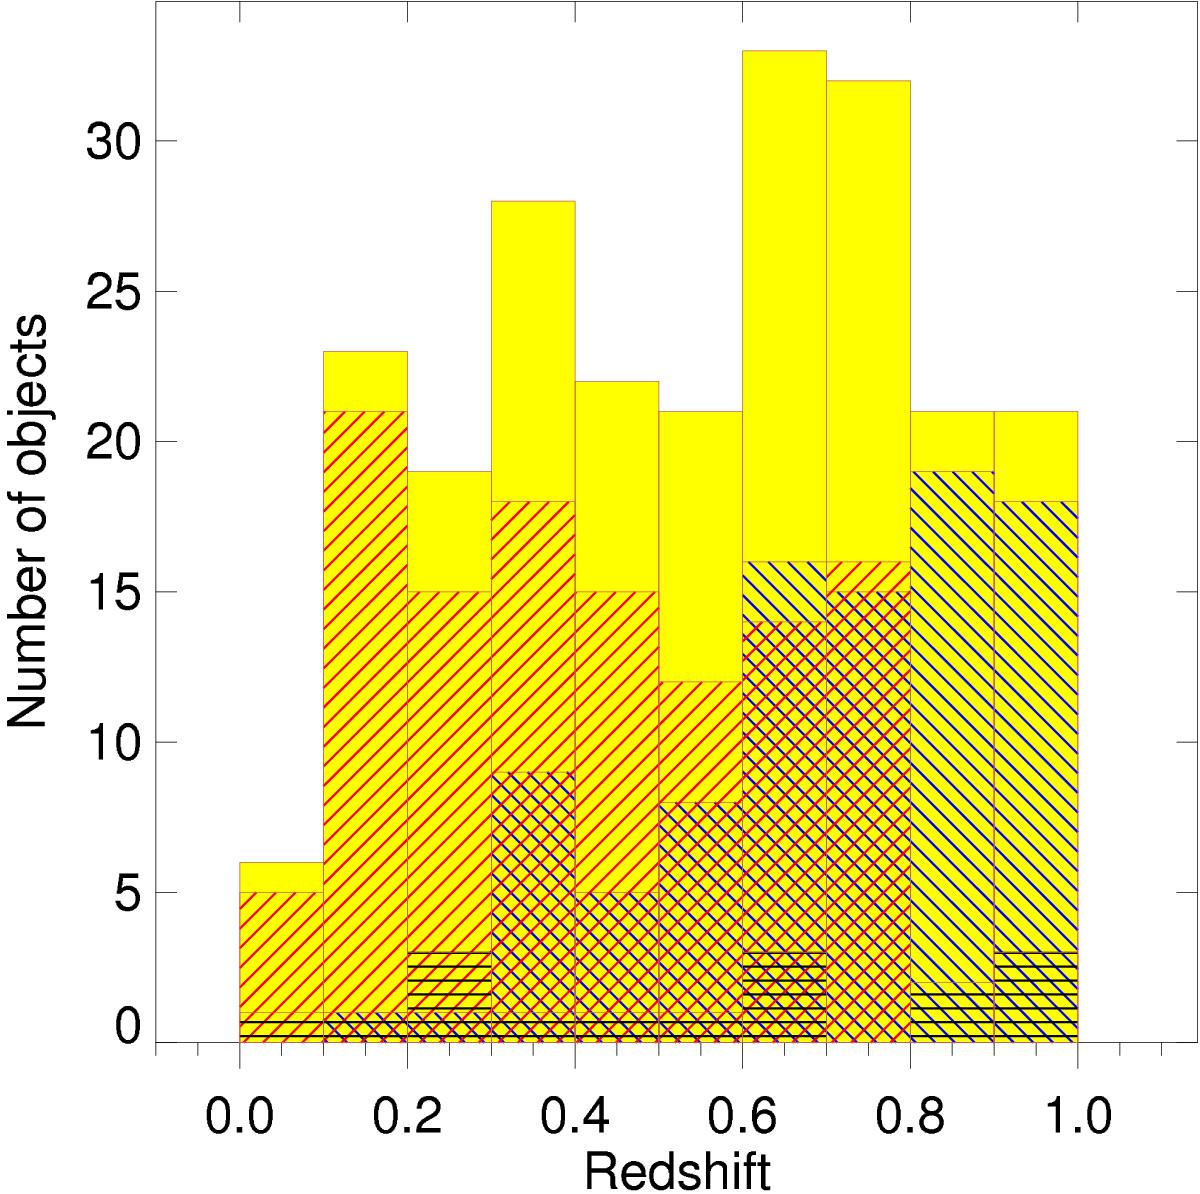
Histogram of the redshift distribution for the quasars in our sample. The red, blue, and black hatched areas identify quasars from the DR7Q, DR9Q, and SDSS archives, respectively. The yellow area denotes the sum of the three subsamples.
Current usage metrics show cumulative count of Article Views (full-text article views including HTML views, PDF and ePub downloads, according to the available data) and Abstracts Views on Vision4Press platform.
Data correspond to usage on the plateform after 2015. The current usage metrics is available 48-96 hours after online publication and is updated daily on week days.
Initial download of the metrics may take a while.