Fig. 2
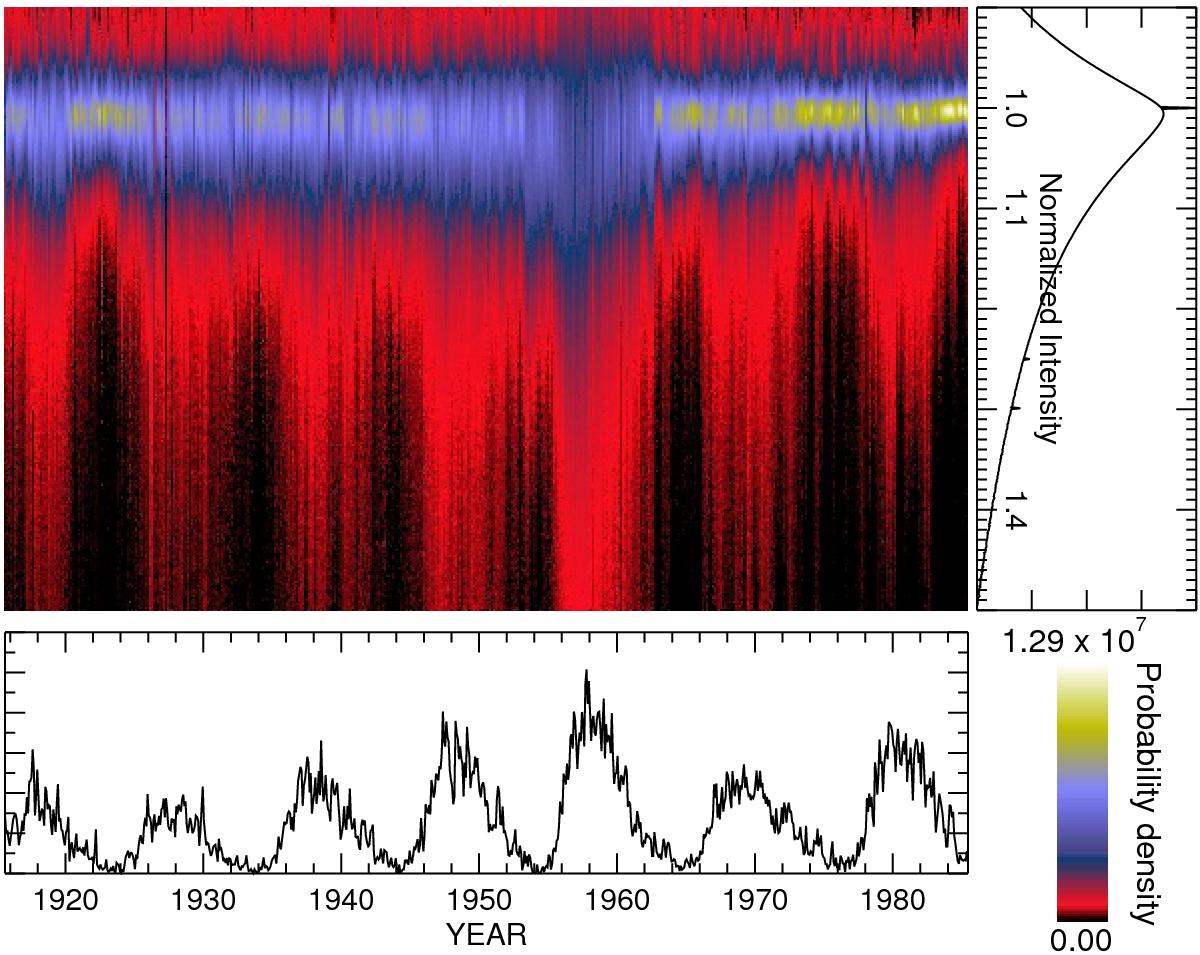
Upper left: 2D histogram of normalized intensities computed for each Carrington rotation. The upper part of the plot corresponds to intensities of 0.9, the lower part to a normalized intensity of 1.5. Upper right: distribution of normalized intensities for all data sets. For reference, the lower panel shows the monthly international sunspot number. The horizontal axis for the upper right panel is the same as in the lower panel. The sharp peaks in the distribution of normalized intensities (upper right panel) at about 1 and about 1.3 are artifacts caused by missing data (whose intensity was set to unity) and erroneous data. The color bar in the lower right corner shows the scaling used for the 2D histogram in the upper left corner.
Current usage metrics show cumulative count of Article Views (full-text article views including HTML views, PDF and ePub downloads, according to the available data) and Abstracts Views on Vision4Press platform.
Data correspond to usage on the plateform after 2015. The current usage metrics is available 48-96 hours after online publication and is updated daily on week days.
Initial download of the metrics may take a while.