Free Access
Fig. 4
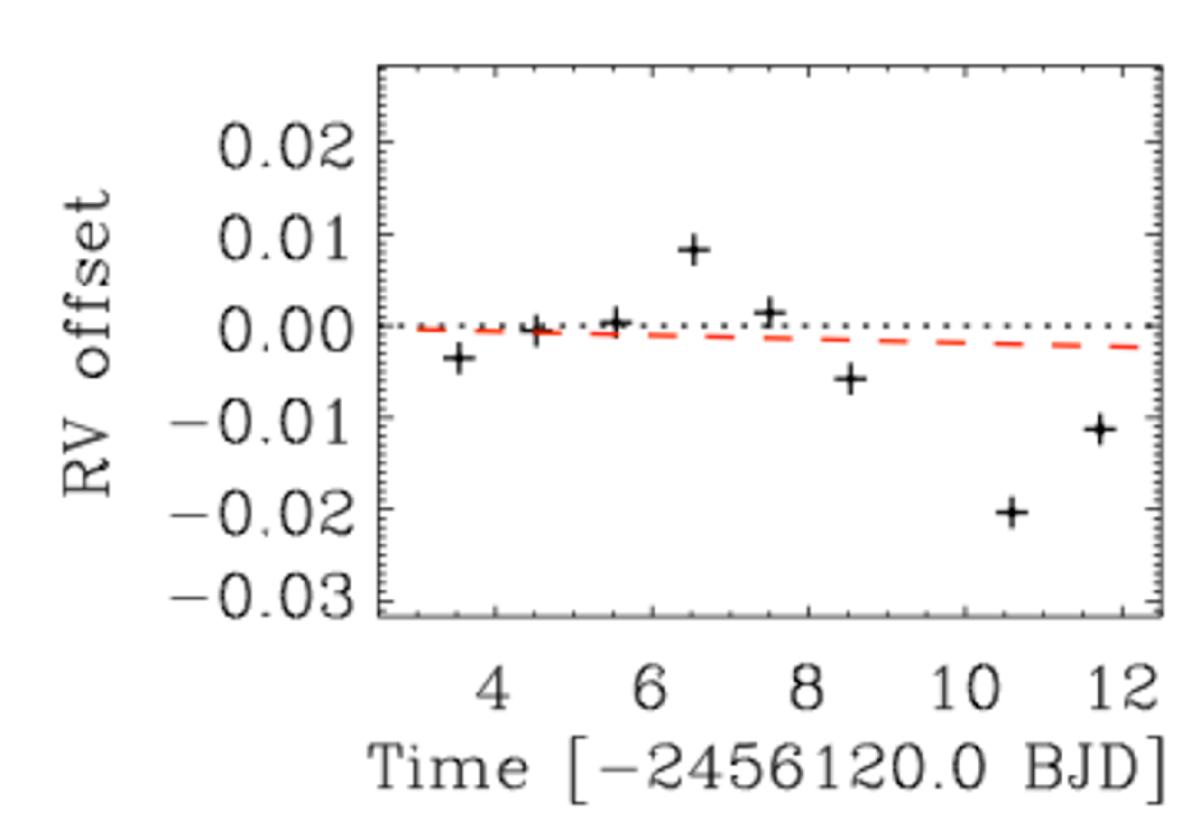
RV variability in m s-1 over the 8-day span of the dataset about the mean (dotted line – 13.232 km s-1). The red line shows the predicted RV contribution of the planet over the same timeframe using the reported ephemeris (Mayor et al. 2004). As in Fig. 3, the x-axis shows the time in Barycentric Julian Date.
Current usage metrics show cumulative count of Article Views (full-text article views including HTML views, PDF and ePub downloads, according to the available data) and Abstracts Views on Vision4Press platform.
Data correspond to usage on the plateform after 2015. The current usage metrics is available 48-96 hours after online publication and is updated daily on week days.
Initial download of the metrics may take a while.