Fig. 2
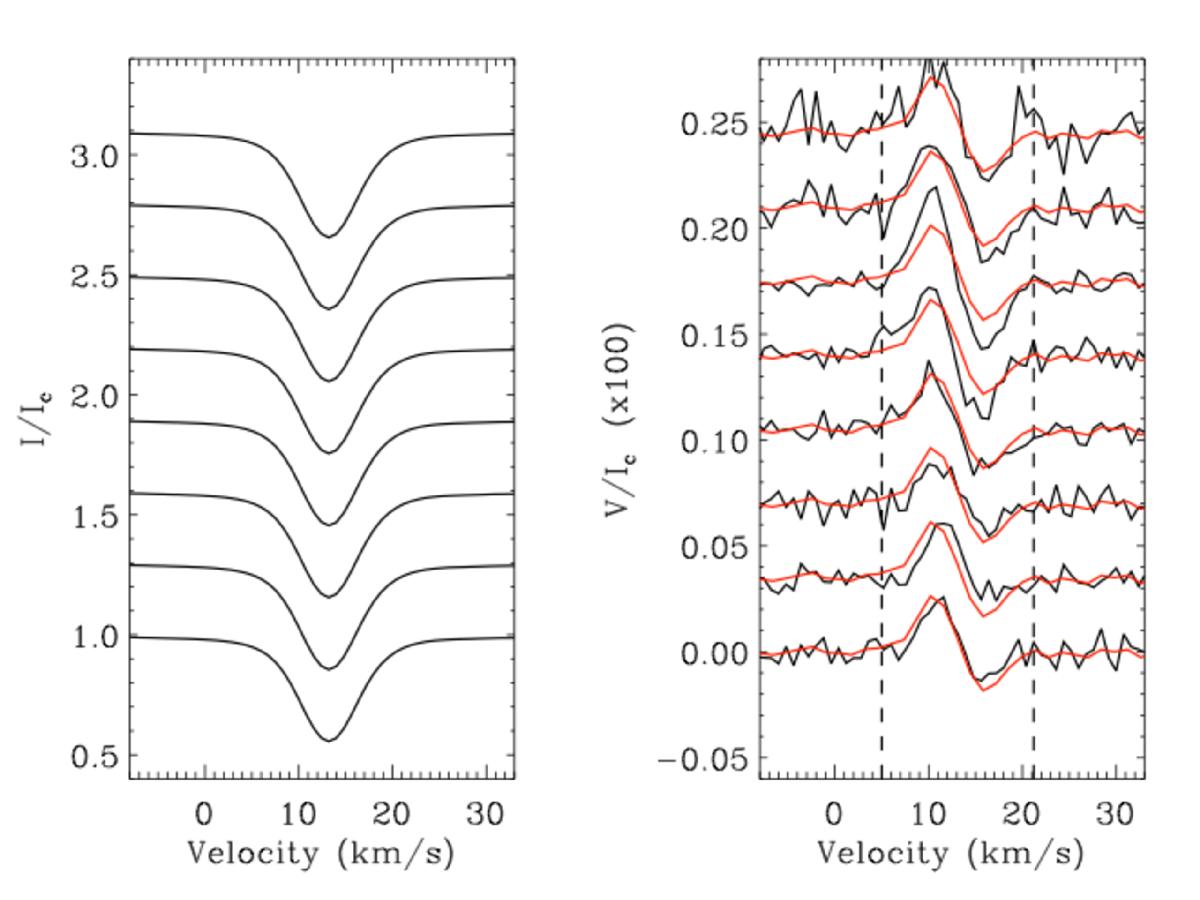
LSD profiles of HD 147513. Left: Stokes I (intensity) and right: Stokes V (circularly polarised) profiles. The mean Stokes V profile computed over this dataset has been overplotted (red line) to investigate variability from night to night. The dashed vertical lines denote the velocity limits over which the Bℓ measurements were calculated.
Current usage metrics show cumulative count of Article Views (full-text article views including HTML views, PDF and ePub downloads, according to the available data) and Abstracts Views on Vision4Press platform.
Data correspond to usage on the plateform after 2015. The current usage metrics is available 48-96 hours after online publication and is updated daily on week days.
Initial download of the metrics may take a while.