Fig. 7
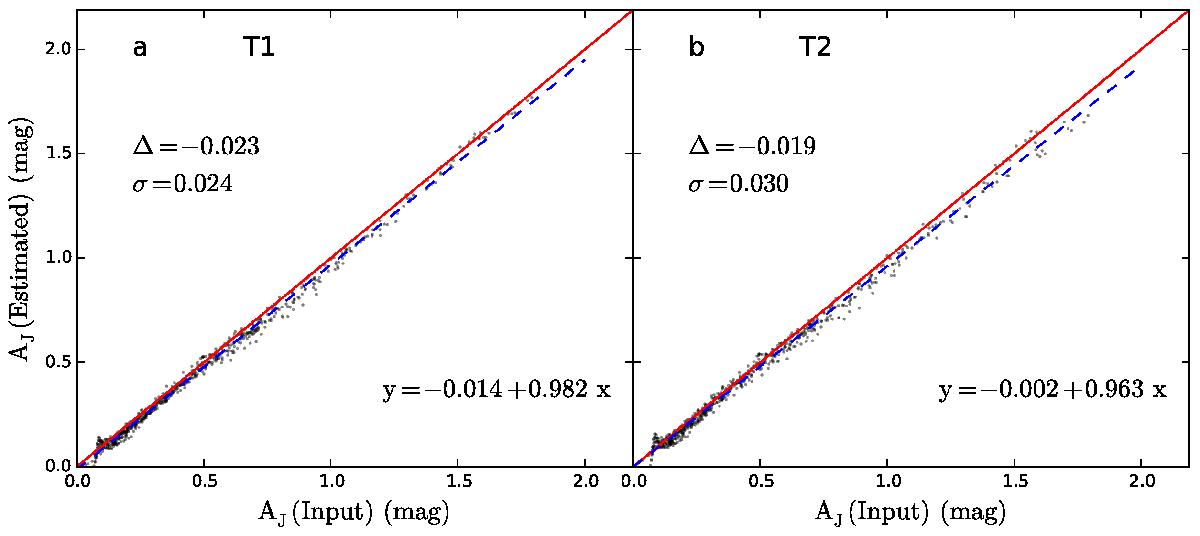
SCEX Method T results plotted against the true values. SCEX calculations use either accurate knowledge of small-scale AJ variations (Method T1, frame a)) or use the NICER extinction map as a template of those variations (Method T2, frame b)). The average bias Δ and rms errors σ, as well as the parameters of least square lines (estimates vs. true values) are given in the frames.
Current usage metrics show cumulative count of Article Views (full-text article views including HTML views, PDF and ePub downloads, according to the available data) and Abstracts Views on Vision4Press platform.
Data correspond to usage on the plateform after 2015. The current usage metrics is available 48-96 hours after online publication and is updated daily on week days.
Initial download of the metrics may take a while.