Fig. 6
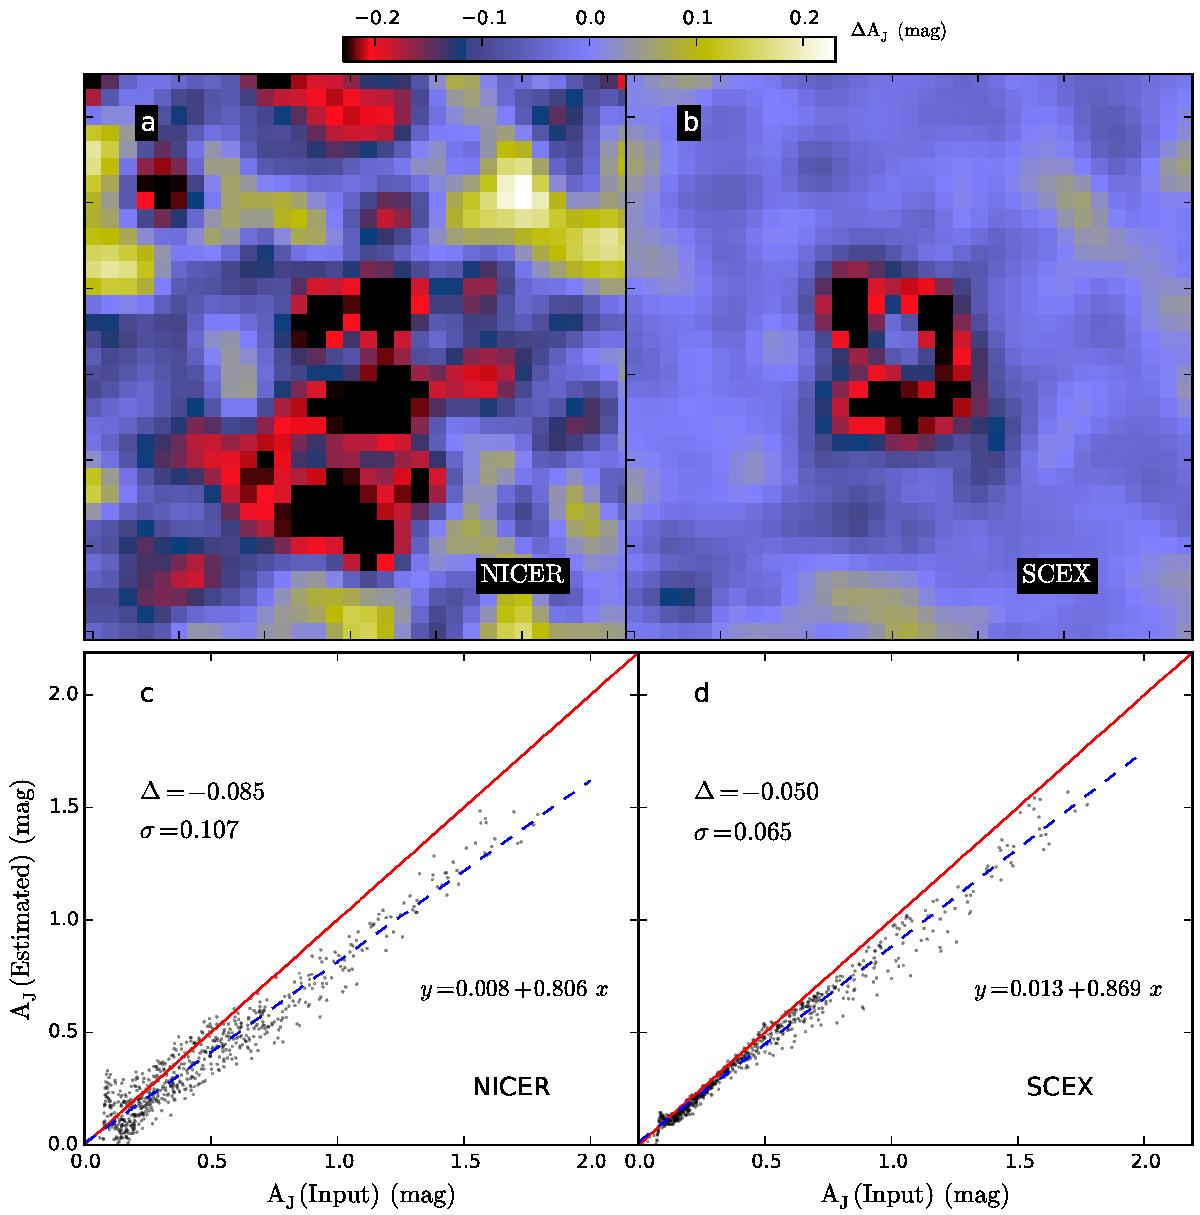
Errors of NICER and SCEX (Method B) extinction estimates in test involving a complex distribution of intrinsic colours (knoise = 0.3). The upper frames show the difference between the calculated extinction maps and the input map convolved to the same 3.0′ resolution. Lower frames show the estimates as a function of the true AJ values. The numerical values of average bias Δ and rms errors σ are given in the figure.
Current usage metrics show cumulative count of Article Views (full-text article views including HTML views, PDF and ePub downloads, according to the available data) and Abstracts Views on Vision4Press platform.
Data correspond to usage on the plateform after 2015. The current usage metrics is available 48-96 hours after online publication and is updated daily on week days.
Initial download of the metrics may take a while.