Fig. 3
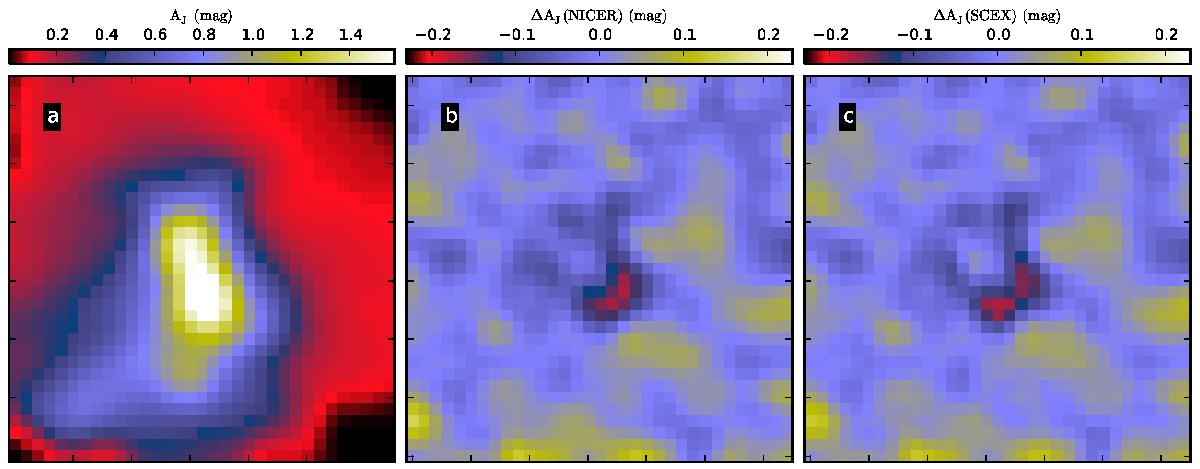
Results of a test with a single Gaussian distribution of intrinsic colours. The leftmost frame shows the input map of AJ that is convolved to 3′, the resolution of the calculated extinction maps. The other frames show the difference between the estimated and the true extinction values for NICER (frame b)) and SCEX Method B (frame c)). The negative values around the column density peak indicate bias that is related to extinction gradients.
Current usage metrics show cumulative count of Article Views (full-text article views including HTML views, PDF and ePub downloads, according to the available data) and Abstracts Views on Vision4Press platform.
Data correspond to usage on the plateform after 2015. The current usage metrics is available 48-96 hours after online publication and is updated daily on week days.
Initial download of the metrics may take a while.