Fig. A.1
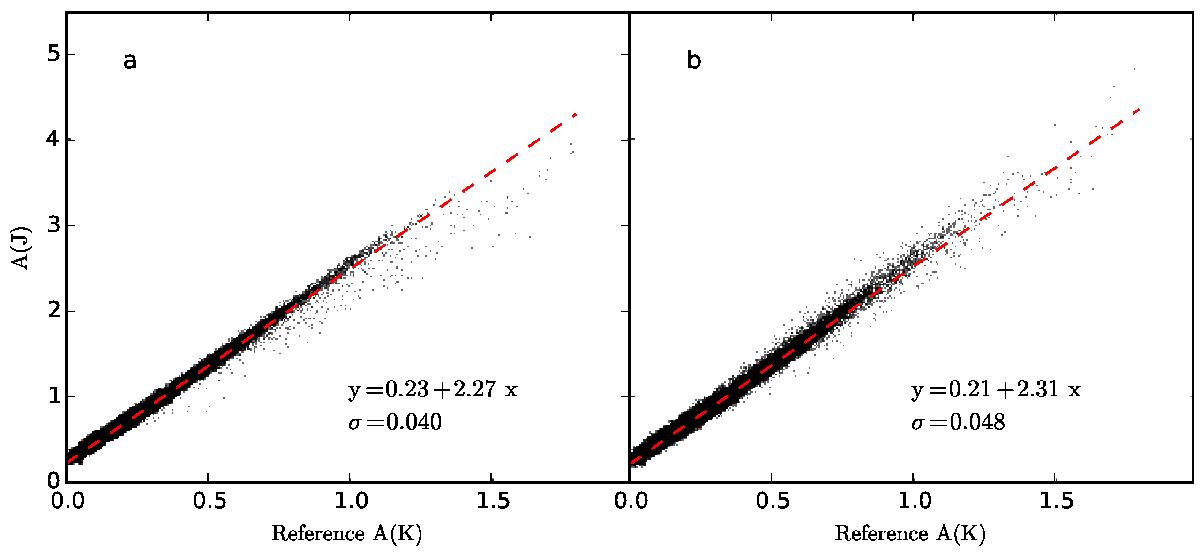
Comparison of our all-sky extinction maps A(J) and the (Lombardi et al. 2006) NICER map given as K-band extinction. The latter has been convolved from the original 1.0′ resolution down to 3.0′ resolution. The all-sky map has been calculated with the NICER method (frame a)) or with a modified method using Method T (frame b)).
Current usage metrics show cumulative count of Article Views (full-text article views including HTML views, PDF and ePub downloads, according to the available data) and Abstracts Views on Vision4Press platform.
Data correspond to usage on the plateform after 2015. The current usage metrics is available 48-96 hours after online publication and is updated daily on week days.
Initial download of the metrics may take a while.