Free Access
Fig. 17
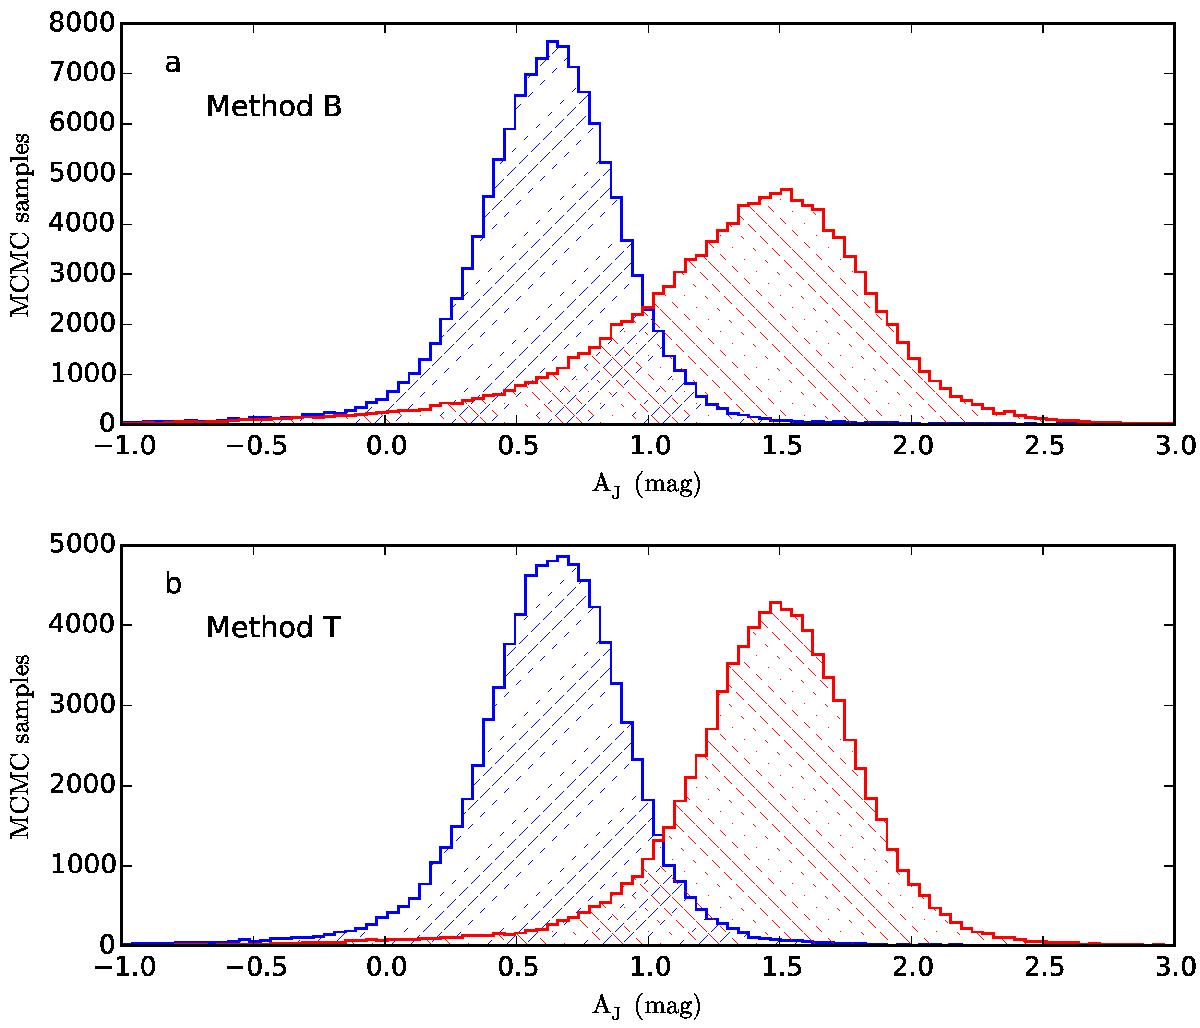
Probability distributions for the extinction in two individual pixels (blue and red histograms) in the maps discussed in Sect. 4.2. Distributions are shown for Method B (upper frame) and Method T (lower frame) for the same pixels.
Current usage metrics show cumulative count of Article Views (full-text article views including HTML views, PDF and ePub downloads, according to the available data) and Abstracts Views on Vision4Press platform.
Data correspond to usage on the plateform after 2015. The current usage metrics is available 48-96 hours after online publication and is updated daily on week days.
Initial download of the metrics may take a while.