Free Access
Fig. 16
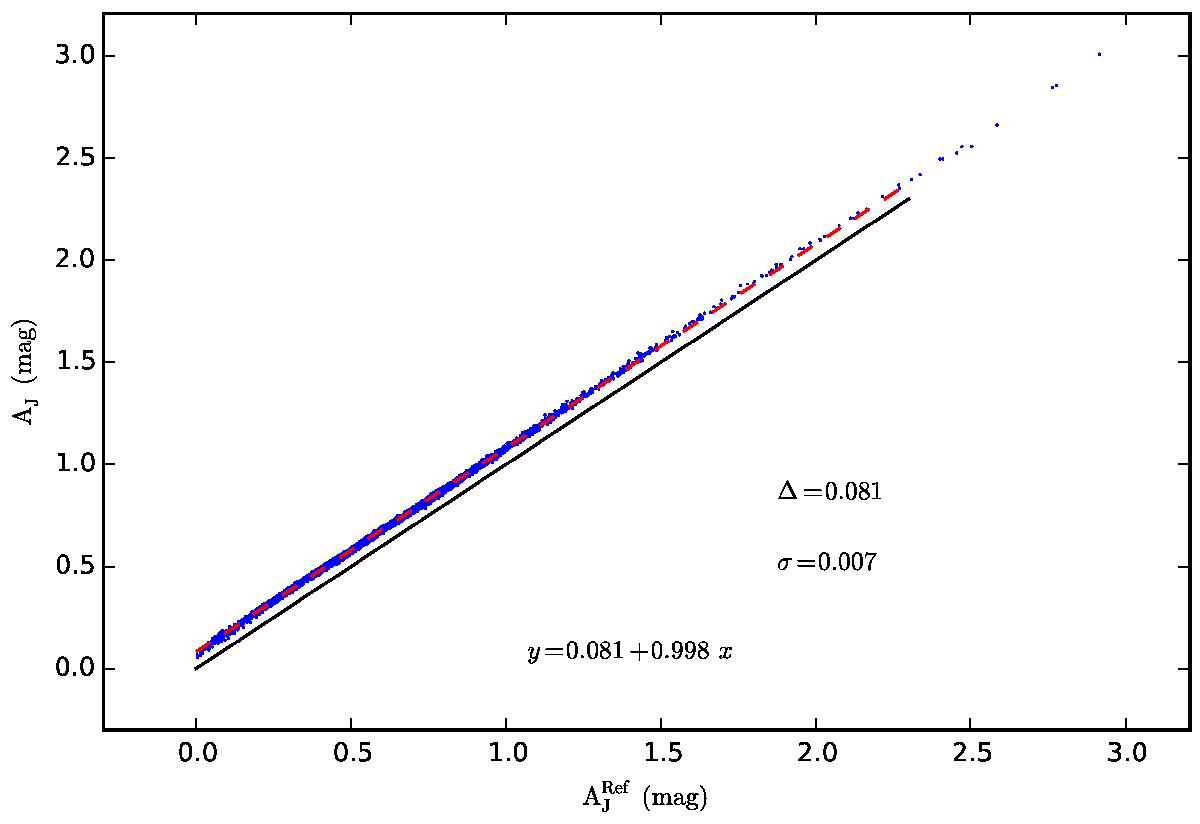
Comparison of Method B with reference colours based on the Besançon model. The colours correspond to two locations along the filament, one below the central latitude (x-axis of the figure, reference position l = 358.8, b = 5.6) and one near the northern end (y-axis of the plot, reference position l = 357.1, b = 7.1).
Current usage metrics show cumulative count of Article Views (full-text article views including HTML views, PDF and ePub downloads, according to the available data) and Abstracts Views on Vision4Press platform.
Data correspond to usage on the plateform after 2015. The current usage metrics is available 48-96 hours after online publication and is updated daily on week days.
Initial download of the metrics may take a while.